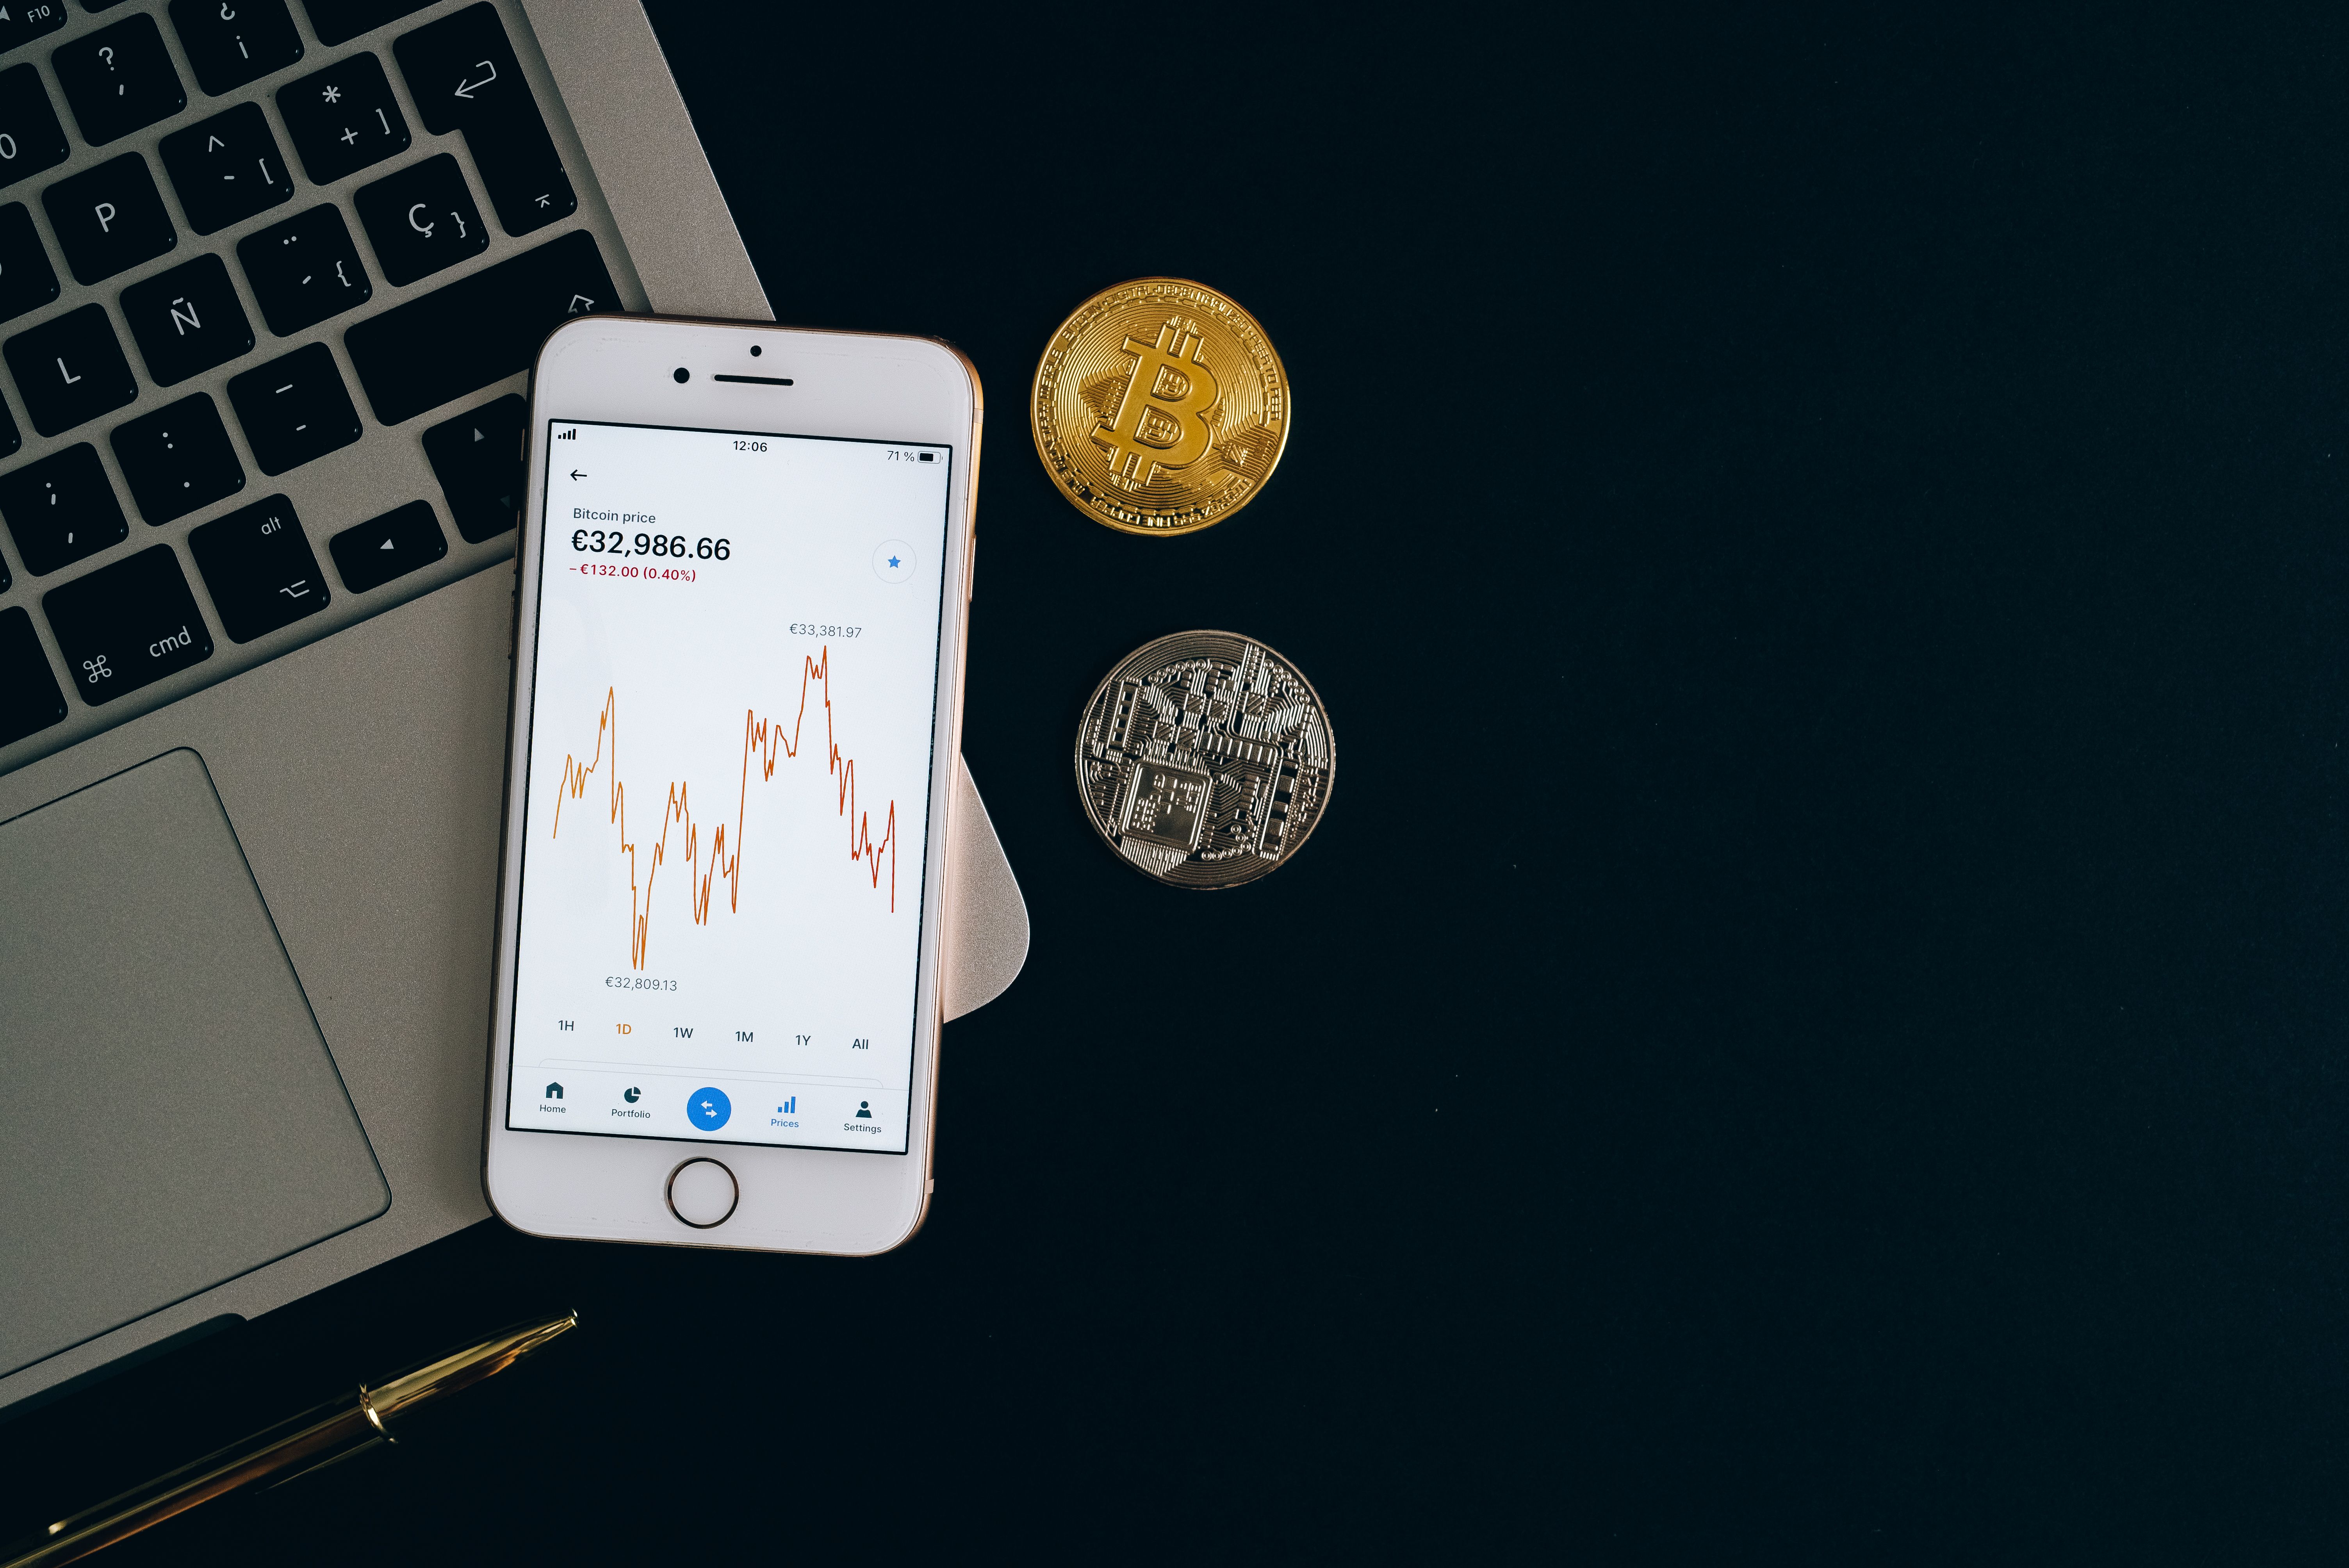
How to Read Crypto Signals: Entry, Stop-Loss, Targets
You see the message at 2 a.m.: "BTC long, enter now, 10x, guaranteed." Your thumb hovers over the buy button. Many losses from signals can come from not knowing how to read the message. Traders who never learned to read the message may not be able to tell a structured trade plan from a pump disguised as advice.
This guide shows you how to break a signal into parts, check each part against the chart, and reject the ones that fail. The examples are hypothetical and use live reference prices. They are not recommendations.
What a Crypto Signal Contains
A crypto signal is a structured trade suggestion. It tells you what to trade, which direction, where to enter, where to exit with a profit and where to exit with a loss. Signals come from human analysts, algorithms, or chart alerts such as TradingView alerts.
For reference, real-time market data as of October 28, 2026: Bitcoin trades at $80,642, Ethereum at $2,343 and Solana at $101. The examples below use these levels.
Core fields
- Pair: for example BTC/USDT.
- Direction: long (buy, expecting a rise) or short (sell, expecting a fall).
- Entry: a price or a zone, such as $80,400 to $80,800.
- Stop-loss: the price where the idea is wrong and you exit.
- Take-profit (TP): one or more exit targets.
- Timeframe: 15-minute, 4-hour, daily. This sets how long the trade may take.
- Margin multiplier: if the signal uses borrowed funds, such as 5x. Higher multipliers shrink the price move needed to liquidate you.
Crypto Signals at a Glance
| Attribute | Detail |
|---|---|
| Name | Crypto trading signals |
| Category | Trade ideas and technical analysis |
| Key features | Pair, direction, entry, stop-loss, take-profit, timeframe |
| Origin | Adapted from forex and equity signal services |
| Delivery platforms | Telegram, Discord, X, TradingView alerts, exchange apps, email |
| Markets | Spot, futures and perpetual contracts on global exchanges |
| Cost models | Free groups, paid subscriptions, automated bots |
Annotated Signal Example
Here is a hypothetical Bitcoin signal, taken apart line by line. BTC is trading near $80,642, so the entry sits just below the current price.
| Signal line | What it means | What to check |
|---|---|---|
| BTC/USDT Long, 4H | Buy bitcoin, swing trade lasting days | Does the 4-hour chart show an uptrend or a base? |
| Entry: $80,600 | Buy near the current price | Has price already moved away? If so, you chase. |
| Stop-loss: $78,900 | Exit if price closes below this level, a $1,700 risk per BTC | Is it below a real support level or a random number? |
| TP1: $83,000 | First target, $2,400 above entry | Does it sit just under a resistance level? |
| TP2: $85,500 | Second target, $4,900 above entry | Is it realistic for the timeframe? |
| Reason: "Reclaimed support, volume rising" | The analyst's thesis | Can you see it on your own chart? |
Visualize it as a vertical ladder. Stop-loss at $78,900 is the bottom rung. Entry at $80,600 is just above it. TP1 at $83,000 and TP2 at $85,500 sit higher. The gap below entry is your risk and the gap above is your reward. If the bottom gap is nearly as big as the top gap, the trade is weak.
Candlestick Colors and Bodies
Every signal chart is built from candles. Each candle shows four prices for its period: open, high, low and close.
- Green (bullish) candle: the close is above the open. Buyers won the period.
- Red (bearish) candle: the close is below the open. Sellers won the period.
- Body: the thick part, from open to close. A long body means strong conviction.
- Wicks (shadows): the thin lines. A long upper wick shows buyers pushed up but sellers rejected the move. A long lower wick shows sellers pushed down but buyers absorbed it.
- Small body with long wicks (doji-style): indecision. Do not treat one as a trigger on its own.
| Candle pattern | Typical reading | Needs confirmation from |
|---|---|---|
| Long green body closing near its high | Strong buying | Rising volume, break of resistance |
| Long lower wick at support | Possible rejection of lower prices | Next candle closing higher |
| Long upper wick at resistance | Possible rejection of higher prices | Next candle closing lower |
| Long red body closing near its low | Strong selling | Break below support |
A candle is not final until it closes. A signal that says "breakout" while the candle is still open can reverse before the close.
Support and Resistance Levels
Support is a price zone where buyers have repeatedly stepped in. Resistance is a zone where sellers have repeatedly capped price. Most good signals place stops and targets around these zones.
How to mark them in four steps
- Switch to a higher timeframe (daily or 4-hour) and zoom out.
- Find swing highs and lows where price turned at least twice.
- Draw zones, not single lines. Use the area covered by the wicks and bodies.
- Compare the signal's stop and targets to your zones.
A stop-loss just below a support zone makes sense. A stop in the middle of open space does not. A take-profit target just under resistance is realistic, because price often stalls there. A target far above a major resistance zone assumes the market will blow straight through it.
Roles flip: broken resistance often becomes support, and broken support often becomes resistance.
RSI, Volume and Trend Confirmation
Indicators do not predict the future. They help you check whether the signal's story matches the data. The indicators below follow their standard textbook definitions.
| Indicator | What it measures | How to use it on a signal |
|---|---|---|
| RSI (default 14 periods) | Momentum on a 0 to 100 scale | Above 70 is conventionally overbought, below 30 oversold. A long entry with RSI at 78 is chasing. |
| Volume | Number of units traded | Breakouts on rising volume are more credible than breakouts on thin volume. |
| Moving averages (50, 200) | Average price over a period | Longs above both averages align with the trend. Longs below both fight it. |
| Higher-timeframe trend | Direction on daily or weekly chart | A 15-minute long inside a daily downtrend carries extra risk. |
Bullish versus bearish evidence
- Bullish: higher highs and higher lows, closes above resistance, volume expanding on green candles, RSI holding above 50.
- Bearish: lower highs and lower lows, closes below support, volume expanding on red candles, RSI failing below 50.
Look for at least two independent confirmations. One indicator agreeing with a signal is not enough.
Risk-to-Reward and Position Size
Risk-to-reward (R:R) compares what you lose if the stop hits against what you gain if the target hits. The formula:
R:R = (target price − entry) ÷ (entry − stop-loss) for a long trade.
Using the annotated example above:
| Item | Calculation | Result |
|---|---|---|
| Risk per BTC | $80,600 − $78,900 | $1,700 |
| Reward to TP1 | $83,000 − $80,600 | $2,400 |
| Reward to TP2 | $85,500 − $80,600 | $4,900 |
| R:R at TP1 | 2,400 ÷ 1,700 | about 1:1.4 |
| R:R at TP2 | 4,900 ÷ 1,700 | about 1:2.9 |
TP1 alone is a mediocre trade. The full trade becomes attractive only if you hold part of the position to TP2. A signal whose best target is below 1:1.5 deserves a pass.
Break-even win rate
Ignoring fees, the win rate needed to break even is 1 ÷ (1 + R:R).
- R:R of 1:1 needs a 50% win rate.
- R:R of 1:2 needs about 33%.
- R:R of 1:3 needs 25%.
Fees, slippage and funding costs raise these numbers slightly.
Position size from your stop
Decide your risk in dollars first, then size the trade. Suppose your account is $10,000 and you risk 1%, which is $100.
- Stop distance as a percentage: $1,700 ÷ $80,600 = about 2.11%.
- Position size: $100 ÷ 0.0211 = about $4,740.
- In BTC: $4,740 ÷ $80,600 = about 0.0588 BTC.
If the stop hits, you lose about $100. The size is set by the stop, not by how confident the message sounds. Our crypto risk management framework covers daily loss limits and portfolio-level exposure.
7 Checks Before You Act on Any Signal

Run every signal through this list. If it fails two or more items, skip it.
- Complete fields. Pair, direction, entry, stop-loss, at least one target and timeframe are all present.
- Stop at a logical level. It sits beyond support (longs) or resistance (shorts), not at an arbitrary round number.
- R:R of 1:1.5 or better. Calculate it yourself. Do not trust the sender's figure.
- Entry still valid. Price has not already run past the entry zone. If it has, wait or skip.
- Chart agrees. Open your own chart and confirm the levels, trend and volume.
- Sensible margin multiplier. A 20x or 50x signal can be liquidated by a normal daily swing.
- Clear invalidation and track record. The sender states when the idea is wrong and publishes a full history, losses included.
Signal Sources Compared
| Source | Cost | Typical strength | Typical weakness | Best used for |
|---|---|---|---|---|
| Free Telegram or Discord groups | Free | Easy access, quick ideas | Unverifiable history, pump-and-dump risk, owners may profit when you buy | Idea generation only, never blind execution |
| Paid signal services | Subscription, varies | Can offer structured plans and rationale | Cost, marketing exaggeration, cherry-picked results | Traders who can audit a full, time-stamped record |
| Automated bots and indicator alerts | Free to paid | Consistent rules, no emotion | Fire in any market condition, need testing | Traders who backtest and understand the rules |
| Your own analysis | Free (your time) | You know the reasoning and the risk | Slow, needs practice | Long-term skill building |
Free signals attract many people because the price is zero, but the sender's incentive is often hidden. Paid services are not automatically better. They are better only when they publish complete, time-stamped results that you can check, including losing trades. Treat any provider that cannot do this as unverified, whatever it charges.
How to judge signal reliability
- Ask for a full trade log with entry time, exit time and result for every call, not highlights.
- Check that results include fees and slippage.
- Look for a meaningful sample size across both rising and falling markets.
- Paper trade the signals for several weeks before risking money.
- Compare the results to simply holding the asset over the same period.
Scam Signals and Red Flags
Fraudsters often use social media and messaging apps to promote investment schemes, and promises of guaranteed or risk-free returns are a classic warning sign. Crypto signal groups are a common vehicle.
| Red flag | Why it matters |
|---|---|
| "Guaranteed profit" or "100% accuracy" | No trader can guarantee returns. Treat it as disqualifying. |
| No stop-loss in the signal | The sender is not managing your risk. |
| Urgency: "buy in the next 10 minutes" | Pressure prevents you from checking the chart. |
| Obscure low-cap coins pushed to a large audience | Classic pump-and-dump pattern. Early buyers sell into your buying. |
| Screenshots of wins only | Easy to fake and cherry-pick. |
| Requests for your exchange API keys with withdrawal rights, or wallet seed phrase | Never share these. Withdrawal permission gives control of your funds. |
| Pressure to deposit on a specific unknown platform | Common route to fake exchanges. |
| Paid "VIP" upsell after free wins | A funnel designed to sell, not to trade. |
Regulation varies by country. In some jurisdictions, selling trading advice may require a license. Check your local regulator before you pay for a service or run one. Nothing in this article is financial advice.
Common Beginner Mistakes
- Entering late. The signal is hours old and price is already near TP1. Your risk is large and your reward small.
- Moving the stop. Widening a stop to avoid a loss turns a small loss into a large one.
- Ignoring the timeframe. A scalp signal held for days behaves differently from a swing trade.
- Sizing by confidence. Size from the stop distance, as shown above.
- Taking every signal. More trades means more fees and more mistakes. Filter hard.
- Skipping the news. Major events can invalidate a technical setup. Check major news headlines before holding through scheduled announcements.
- Using high margin multipliers. At 10x, a 10% adverse move can wipe out the position, before fees and funding.
Psychology and Portfolio Fit
Fear of missing out can push traders to skip their checklist. Two habits help. First, write the plan before you enter: entry, stop, targets and size. Second, set the stop order on the exchange so you are not deciding under stress.
Signals should fit a portfolio, not replace one. A practical approach:
- Keep a core long-term allocation separate from your signal trading account.
- Cap total open risk, for example no more than 3% to 5% of the trading account across all open trades.
- Set a daily or weekly loss limit and stop trading when you hit it.
- Avoid taking five signals that are all long on correlated assets, because they behave as one large bet.
- Log every trade and review the log monthly.
If you trade ideas on-chain, see our primer on DeFi risks for beginners. For macro context around equities and crypto, read our crypto market analysis hub.
Practical Walkthrough: Reading an Ethereum Signal
Hypothetical signal: ETH/USDT short, 1H, entry $2,340, stop $2,390, TP $2,220. ETH currently trades at $2,343 per real-time market data as of October 28, 2026.
- Risk: $2,390 − $2,340 = $50 per ETH.
- Reward: $2,340 − $2,220 = $120 per ETH.
- R:R: 120 ÷ 50 = 2.4, so about 1:2.4. Acceptable.
- Chart check: is $2,390 just above a recent swing high or resistance? If yes, the stop is logical. Is $2,220 just above a known support zone? If yes, the target is realistic.
- Trend check: a short against a strong daily uptrend is a counter-trend trade. Reduce size or skip.
Experience Notes: What Usually Goes Wrong
Most failed signal trades share the same few causes, all visible before entry. The stop is too tight for the timeframe: a 1% stop on a 4-hour chart can be hit by normal noise. The entry is stale: by the time you read the message, price may have moved 1% to 2%, which on a tight setup eats a large part of the reward. Fees add up as well. Exchanges charge separate maker and taker fees, and perpetual futures add funding payments, so check your exchange's official fee schedule before judging a strategy's profit. The fixes are mechanical: use limit orders at the stated entry, skip trades where price has left the entry zone, place stops beyond structure rather than at round numbers, and always calculate position size from the stop distance. The trade-off is honest: you will miss some winners. Missing a trade costs nothing, while taking a bad one costs capital.
FAQ

What is a crypto signal?
A crypto signal is a trade suggestion that states an asset, direction, entry price, stop-loss and take-profit targets. It may come from an analyst, a bot or a chart alert.
How to read crypto signals as a beginner?
Identify the pair and direction, then check the entry, stop-loss and targets. Calculate the risk-to-reward ratio, confirm the levels on your own chart, and size the position from the stop distance. Skip any signal missing a stop-loss.
Is it safe to follow free crypto signals?
Not blindly. Free groups often have unverifiable records and hidden incentives, such as promoting coins the owners already hold. Use them for ideas, verify each setup yourself, and never share API keys or seed phrases.
Why do many crypto signals lose money?
Common reasons are late entries, tight stops, high margin multipliers, poor risk-to-reward and fees. Some signals are also designed to benefit the sender rather than the follower.
What risk-to-reward ratio should a signal have?
As a rule of thumb, a ratio of at least 1:2 is a reasonable target. At 1:2, you need roughly a 33% win rate to break even before fees. The lower the risk-to-reward ratio, the higher the win rate needed to break even.
Related Reading
- Complete crypto guide
- how to read candlestick charts
- crypto support and resistance guide
- crypto risk management guide
- technical analysis basics for stocks
- More trading articles
Disclosure: Pro Trader Daily and xpertrax.com are operated by the same owner. Links and pop-ups pointing to xpertrax.com promote our own products. This article is for information only and is not financial advice.