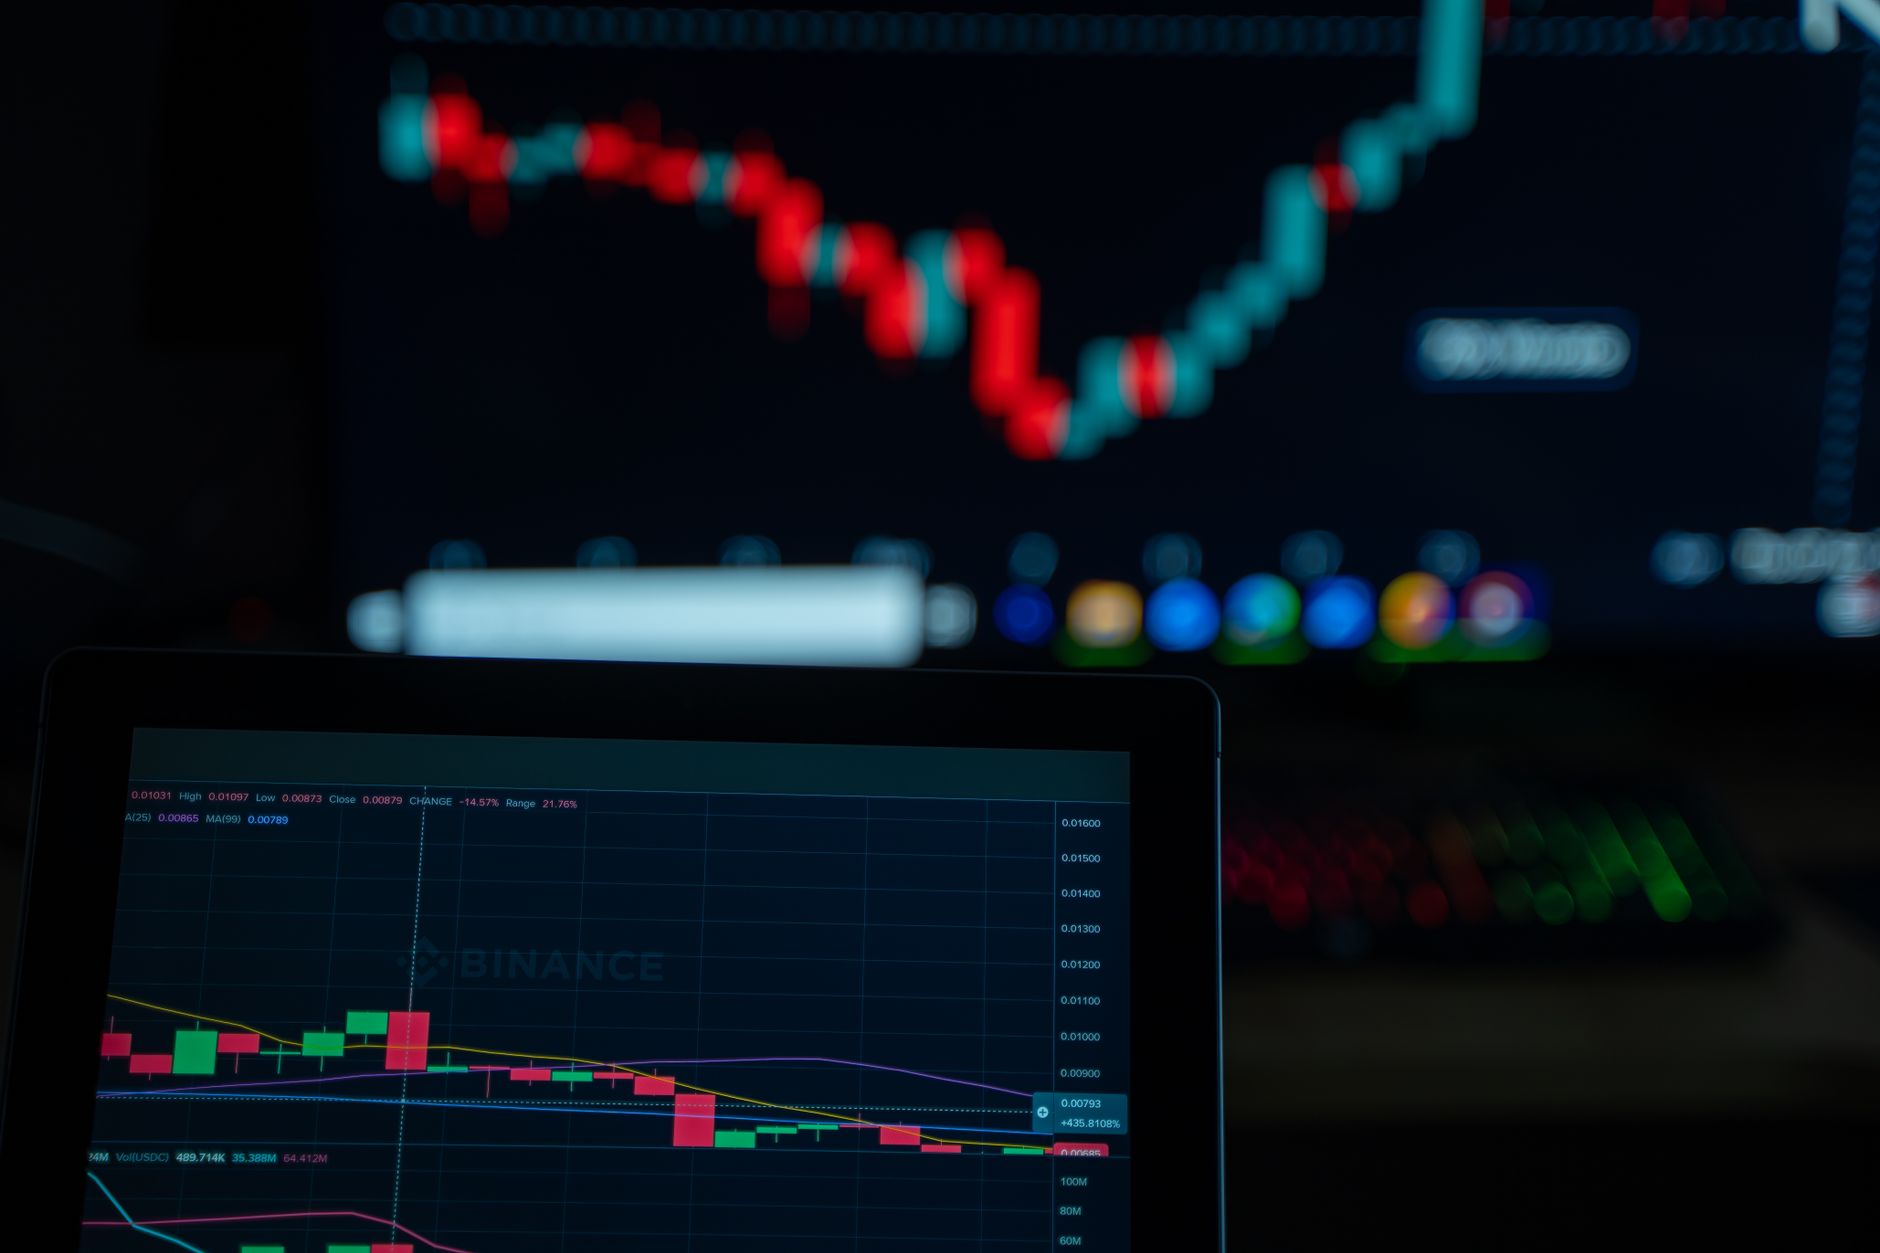
Why Every Crypto Trader Needs a Structured Market Analysis Framework
The cryptocurrency market moves at a pace unlike traditional finance. Bitcoin surged $64,288 on August 19, 2026, with intraday volatility creating both opportunity and danger. Ethereum traded at $1,909, while emerging assets like Solana ($76.82) showed distinct technical patterns. Without structured analysis, traders become reactive gamblers. With it, they become strategic decision-makers.
This guide walks you through the three pillars of professional crypto analysis, introduces industry-standard tools, and provides a repeatable framework you can apply today. Whether you're analyzing a major asset like Bitcoin or an alternative token, the methodology remains consistent.
What Is Crypto Market Analysis?
Crypto market analysis is the systematic evaluation of price data, project fundamentals, blockchain activity, and market psychology to forecast future price movements and identify trading opportunities. It differs fundamentally from stock analysis because:
- Cryptocurrency markets operate 24/7 without circuit breakers
- Projects often lack traditional financial statements or revenue models
- On-chain data provides real-time transaction transparency unavailable in traditional markets
- Regulatory landscape shifts rapidly across jurisdictions
- Sentiment-driven price swings can outweigh fundamental value in the short term
Professional traders use three complementary approaches—technical, fundamental, and on-chain analysis—rather than relying on any single method. This reduces blind spots and increases decision confidence.
Technical Analysis: Reading the Charts
Technical analysis interprets historical price and volume data to predict future movements. The assumption is that all available information is already reflected in price, and patterns repeat due to human psychology.
Core Technical Indicators
Moving Averages (MA): The 50-day and 200-day moving averages are the most watched in crypto. When price trades above both, traders call this an "uptrend." When price falls below both, a "downtrend" is confirmed. Bitcoin's price relative to its 200-day MA has historically been one of the strongest long-term trend signals.
Relative Strength Index (RSI): This momentum oscillator ranges from 0 to 100. Readings above 70 suggest overbought conditions; below 30 suggests oversold. On a 4-hour Ethereum chart, RSI approaching 30 often precedes short-term recoveries. However, during strong bull runs, RSI can remain elevated (70+) for extended periods without immediate reversals.
MACD (Moving Average Convergence Divergence): This shows momentum shift. When the MACD line crosses above the signal line, bullish momentum enters. Below the signal line, bearish momentum dominates. Many traders use MACD on daily timeframes for swing trading signals.
Bollinger Bands: These dynamic bands widen during volatility and tighten during consolidation. Price touching the upper band doesn't mean immediate reversal—it often signals strength in trending markets. Touches of the lower band in downtrends similarly don't guarantee bounces without additional confirmation.
Common Chart Patterns
Head and Shoulders: A reversal pattern where price creates two lower peaks surrounding a higher center peak. The "neckline" breakout signals a potential trend reversal. This pattern has shown predictive value across crypto markets, though volume confirmation is essential.
Double Top / Double Bottom: Resistance or support tested twice at the same level, followed by a breakout. These patterns often precede significant moves, particularly on daily and weekly timeframes.
Breakout Consolidation: After periods of tight trading ranges, price typically breaks in one direction with increased volume. Early breakout traders position before the move completes, while conservative traders wait for confirmation.
Volume as Confirmation
Volume validates price movement. A price surge on low volume is weak; the same surge on high volume is strong. In crypto, exchange volume data from CoinMarketCap provides real-time volume across major trading pairs.
Fundamental Analysis: Evaluating Projects
While technical analysis answers "When might price move?", fundamental analysis answers "Should I hold this asset long-term?" This requires evaluating the project's viability, team credibility, market opportunity, and tokenomics.
Project Team and Development
Review GitHub commit history for active development. A project claiming innovation but showing minimal code updates is a red flag. Teams with publicly identifiable developers (names, LinkedIn profiles, prior experience) are lower risk than anonymous founders. However, some legitimate privacy-focused projects do operate anonymously—context matters.
Tokenomics: Supply and Distribution
Examine total token supply, circulating supply, and unlock schedules. Cardano (ADA) trades at $0.1741 with a fixed supply cap of 45 billion tokens. Projects with unlimited supplies (Dogecoin at $0.0699 has no supply cap) experience ongoing inflation that pressures long-term price growth, though this doesn't preclude short-term gains.
Check vesting schedules for founder tokens. If core team members have large token allocations unlocking soon, anticipate selling pressure. Transparent projects publish this information publicly.
Use Case and Market Size
Evaluate the problem the project solves. Does it address a real market inefficiency, or is it solving a problem nobody has? Ethereum's smart contract capability opened massive addressable markets in DeFi, NFTs, and enterprise applications. Smaller projects targeting niche use cases may have less growth potential unless they achieve exceptional market penetration.
Competitive Landscape
No project exists in isolation. Polkadot (DOT) at $0.75 competes with Ethereum, Solana (SOL) at $76.82, and others for developer mindshare and transaction volume. Understanding competitive positioning helps you assess long-term viability.
On-Chain Metrics: The Blockchain Truth
On-chain analysis examines actual blockchain activity—transactions, smart contract interactions, and large holder movements. This data is transparent and cannot be faked, making it one of the most reliable analysis sources.
Transaction Volume and Network Activity
High transaction volume suggests genuine network utility. Bitcoin processed over 300,000 transactions daily as of August 2026, indicating active use. Compare this to smaller assets and you gain perspective on adoption depth. However, a single large transaction can artificially spike volume—look at average transaction size as well.
Whale Movements
Whale wallets (containing 1% or more of an asset's circulating supply) significantly influence price when they move funds. Tools like Blockchain.com and Etherscan show large transactions in real-time. When a whale transfers tokens to an exchange, it often signals a pending sale. Transfers to personal cold storage suggest long-term holding. Experienced traders monitor whale activity as an early warning system.
Exchange Inflows and Outflows
Tracking when large amounts of crypto move into or out of exchanges reveals trader intent. Inflows often precede price declines (holders preparing to sell). Outflows suggest accumulation (holders moving crypto to secure storage). This data from providers like CryptoQuant shows material patterns when tracked consistently over time.
Active Addresses
The number of active addresses daily indicates network health. Bitcoin's active address count in the 600,000-900,000 range reflects sustained adoption. A declining trend despite rising price suggests whale concentration and lower genuine demand—a potential bearish divergence.
Tools and Platforms Comparison
Professional traders don't rely on a single platform. Each tool specializes in different analysis types:
| Platform | Best For | Free Tier? | Key Strength |
|---|---|---|---|
| TradingView | Technical analysis and charting | Yes (limited) | Customizable indicators, institutional-grade charting, active community scripts |
| CoinMarketCap | Price data and market overview | Yes | Comprehensive asset listings, historical data, market cap rankings |
| CoinGecko | Fundamental metrics and rankings | Yes | Community-driven data, no API restrictions on free tier, detailed project pages |
| Glassnode | On-chain analysis | Limited free access | Professional on-chain indicators, whale tracking, network health metrics |
| DefiLlama | DeFi ecosystem metrics | Yes | Total value locked by protocol, yield farming comparisons, cross-chain data |
Practical Workflow: Start your analysis on CoinMarketCap or CoinGecko to identify candidates. Use TradingView to review technicals on multiple timeframes (4-hour, daily, weekly). Cross-reference with Glassnode for on-chain confirmation. This three-layer approach catches opportunities others miss.
Risk Management and Portfolio Strategy
Analysis predicts opportunity; risk management preserves capital. Many traders execute perfect analysis only to lose everything due to poor position sizing or no stop-loss discipline.
Position Sizing
A common rule: never risk more than 2% of your portfolio on a single trade. If your account is $10,000, your maximum loss per trade should be $200. This means if your stop-loss sits 4% below entry, your position size is 50 coins (if buying at $100 per coin). This formula protects you through inevitable losing streaks without catastrophic drawdowns.
Stop-Loss Discipline
Place stops at logical technical levels—below support zones, outside Bollinger Bands, or at a percentage deviation (5-8% for swing trades). The stop must be set before you enter, never adjusted upward after entry (moving stops down is acceptable only when locking in profits). Emotional traders who "just hold through" breakdowns often watch small losses become account-destroying losses.
Take-Profit Targets
Establish profit targets using technical resistance levels or reward-to-risk ratios. If your stop-loss is $200 and you expect a $600 profit, your risk-reward is 1:3—highly favorable. Don't move profit targets higher after hitting them; instead, scale out of the position (sell 50% at first target, let remainder run with a trailing stop).
Portfolio Diversification
Holding only Bitcoin reduces you to its specific risks; holding 20 low-cap altcoins concentrates risk on coins with minimal liquidity. A balanced approach: 40% large-cap (Bitcoin, Ethereum), 30% mid-cap (Solana, Cardano, Polkadot), 20% smaller positions in emerging opportunities, 10% stablecoins (emergency dry powder). Adjust weights based on your conviction and risk tolerance.
Reading Market Sentiment
Sentiment is the collective psychology driving short-term price action. Three methods track it:
Fear and Greed Index
This composite metric (available free on alternative.me) combines volatility, momentum, social media posts, dominance metrics, and trend data into a 0-100 score. Extreme Greed (above 80) historically precedes corrections; Extreme Fear (below 20) often precedes recoveries. Use it as a filter, not a signal alone. During August 2026, the index would reflect current sentiment—check real-time readings before trading.
Social Media Sentiment
Monitor Twitter, Reddit's cryptocurrency communities, and Discord channels where active traders congregate. When sentiment turns universally bullish and newer traders discuss "getting rich quick," contrarian indicators suggest caution—smart money often exits into euphoria. Conversely, when discussions turn entirely negative and experienced traders discuss exit strategies, accumulation often begins.
Funding Rates on Futures Exchanges
High positive funding rates on perpetual futures (where longs pay shorts) indicate excessive leverage on long positions. This creates vulnerability to liquidation cascades during pullbacks. Negative funding rates suggest excessive shorts and potential short squeezes. Binance and FTX publishing rates publicly allows free monitoring.
Frequently Asked Questions
What is the difference between technical and fundamental analysis in crypto?
Technical analysis forecasts price movements based on historical patterns and indicators, working across any timeframe (5-minute to yearly). Fundamental analysis evaluates whether an asset has real underlying value based on project viability, adoption, and team credibility. Technicals work in bull and bear markets; fundamentals determine whether you should hold long-term. Professional traders use both simultaneously.
How to analyze cryptocurrency without paid tools?
Use free platforms: TradingView (free charting with limited indicators), CoinMarketCap, CoinGecko (complete project data), and blockchain explorers (Etherscan for Ethereum, Blockchain.com for Bitcoin). Many traders begin here and upgrade to paid tools only after proving their analysis method generates consistent edge. Free alternatives are sufficient for learning and early trading.
Is crypto market analysis safe to rely on for trading?
Analysis reduces risk but doesn't eliminate it. Even perfectly executed technical trades fail when unexpected news breaks (regulatory changes, security breaches). No analysis method predicts with 100% certainty. Professional traders view analysis as improving win rates from 40% to 55-60%, not guaranteeing winners. Combine analysis with strict risk management to survive inevitable losing trades.
Why do crypto prices sometimes defy technical patterns?
Patterns work probabilistically, not mechanically. When Bitcoin breaks a support level on high volume, the probability of further decline increases—but it's not guaranteed. Low-liquidity altcoins break patterns more frequently than Bitcoin because whale manipulation is easier. Regulatory news, exchange hacks, and macro economic shocks override technical signals. Treat patterns as probabilities, not certainties.
How often should I analyze my portfolio?
Swing traders analyzing 4-hour and daily charts should review positions daily (15-30 minutes). Investors holding long-term positions need weekly or monthly reviews. Active day traders monitor intraday charts constantly. Match analysis frequency to your trading timeframe—analyzing every 5 minutes for a position held 6 months is wasted effort.
Crypto Market Analysis: Entity Overview
| Category | Financial Analysis Methodology |
| Primary Components | Technical analysis (charts, indicators), fundamental analysis (project viability), on-chain metrics (blockchain activity) |
| Global Market Cap (Reference) | Approximately $2.2 trillion as of August 2026 |
| Major Assets Analyzed | Bitcoin ($64,288), Ethereum ($1,909), Solana ($76.82), and 25,000+ other cryptocurrencies |
| Industry Standard Tools | TradingView, CoinMarketCap, CoinGecko, Glassnode, Chainalysis |
| Target Users | Traders, investors, institutional fund managers, retail speculators |
| Time Horizons | Scalable: 5-minute charts (day trading) to 1-year charts (long-term investing) |
"The majority of crypto traders skip fundamental analysis because chart patterns feel simpler. This creates a structural edge for disciplined traders who combine technical, fundamental, and on-chain methods. Price eventually follows value, but psychology dominates short-term moves."
Actionable Next Steps
You now understand the three pillars of crypto market analysis. Here's how to implement immediately:
- Choose one coin to analyze deeply. Bitcoin or Ethereum are ideal (highest volume, clearest patterns). Avoid low-cap tokens for your first analysis—liquidity and data quality matter.
- Set up free accounts on TradingView and CoinGecko. Load a 4-hour and daily chart of your chosen asset. Pull up the 50/200-day moving averages, RSI, and MACD. Observe the current price relative to these levels.
- Review the project's fundamentals. If analyzing Bitcoin, understand its fixed supply (21 million), mining incentives, and network security model. If analyzing Ethereum, understand smart contract functionality and gas fee mechanisms.
- Check on-chain activity. Use Etherscan or Blockchain.com to see recent whale movements and transaction counts. Are addresses accumulating or distributing?
- Document your analysis in a spreadsheet. Note the date, current price, technical setup (overbought/oversold/neutral), fundamental outlook (positive/neutral/negative), and on-chain sentiment (accumulation/distribution). Over 20-30 analyses, patterns in your own decision-making emerge.
Analysis is a learned skill, not innate talent. Every professional trader started where you are now, building competence through repetition and documented results.
For deeper dives into specific assets and technical setups, explore our complete analysis section, which covers cryptocurrency-specific research and active trading strategies. If you're evaluating projects for long-term investment, see our investment methodology guide.
Check Real-Time Crypto Prices