Ethereum Price Forecast 2026-2030: Why Expert Predictions Diverge
The Ethereum price forecast market is flooded with extreme predictions—some claiming $50,000, others predicting $100. Neither reflects market reality. As a trader or investor evaluating Ethereum's true trajectory, you need data grounded in technical analysis, on-chain metrics, and fundamentals, not hype.
Right now, Ethereum sits at $1,882 per ETH (as of August 15, 2026), trading between resistance at $1,925 and support around $1,800. The question isn't whether Ethereum will moon—it's what realistic valuation range makes sense for 2026, 2027, and 2030 given macro headwinds, protocol developments, and competitive pressure from Layer-1 blockchains.
This analysis separates fact from fiction, examining consensus forecasts, technical patterns, and the fundamentals that actually move Ethereum's price over the next 12-48 months.
Current Price & Market Position
Ethereum is currently priced at $1,882, reflecting a 24-hour change of +0.84%. This places Ethereum firmly in consolidation territory, trading between key technical levels:
- Resistance Level: $1,925 (nearest overhead supply)
- Support Level: $1,800 (critical demand zone)
- Market Cap: ~$226 billion USD (real-time data as of August 15, 2026)
- Trading Volume: Elevated across spot and derivatives markets
For context, according to CoinGecko, Ethereum's dominance in the altcoin market sits around 18–22%, a steady but competitive position given the rise of Solana, Polkadot, and BNB Chain. The $1,800–$1,925 range has acted as a critical support-resistance band over the past 90 days, suggesting equilibrium price discovery.
Technical Analysis: W-Pattern Bullish Setup
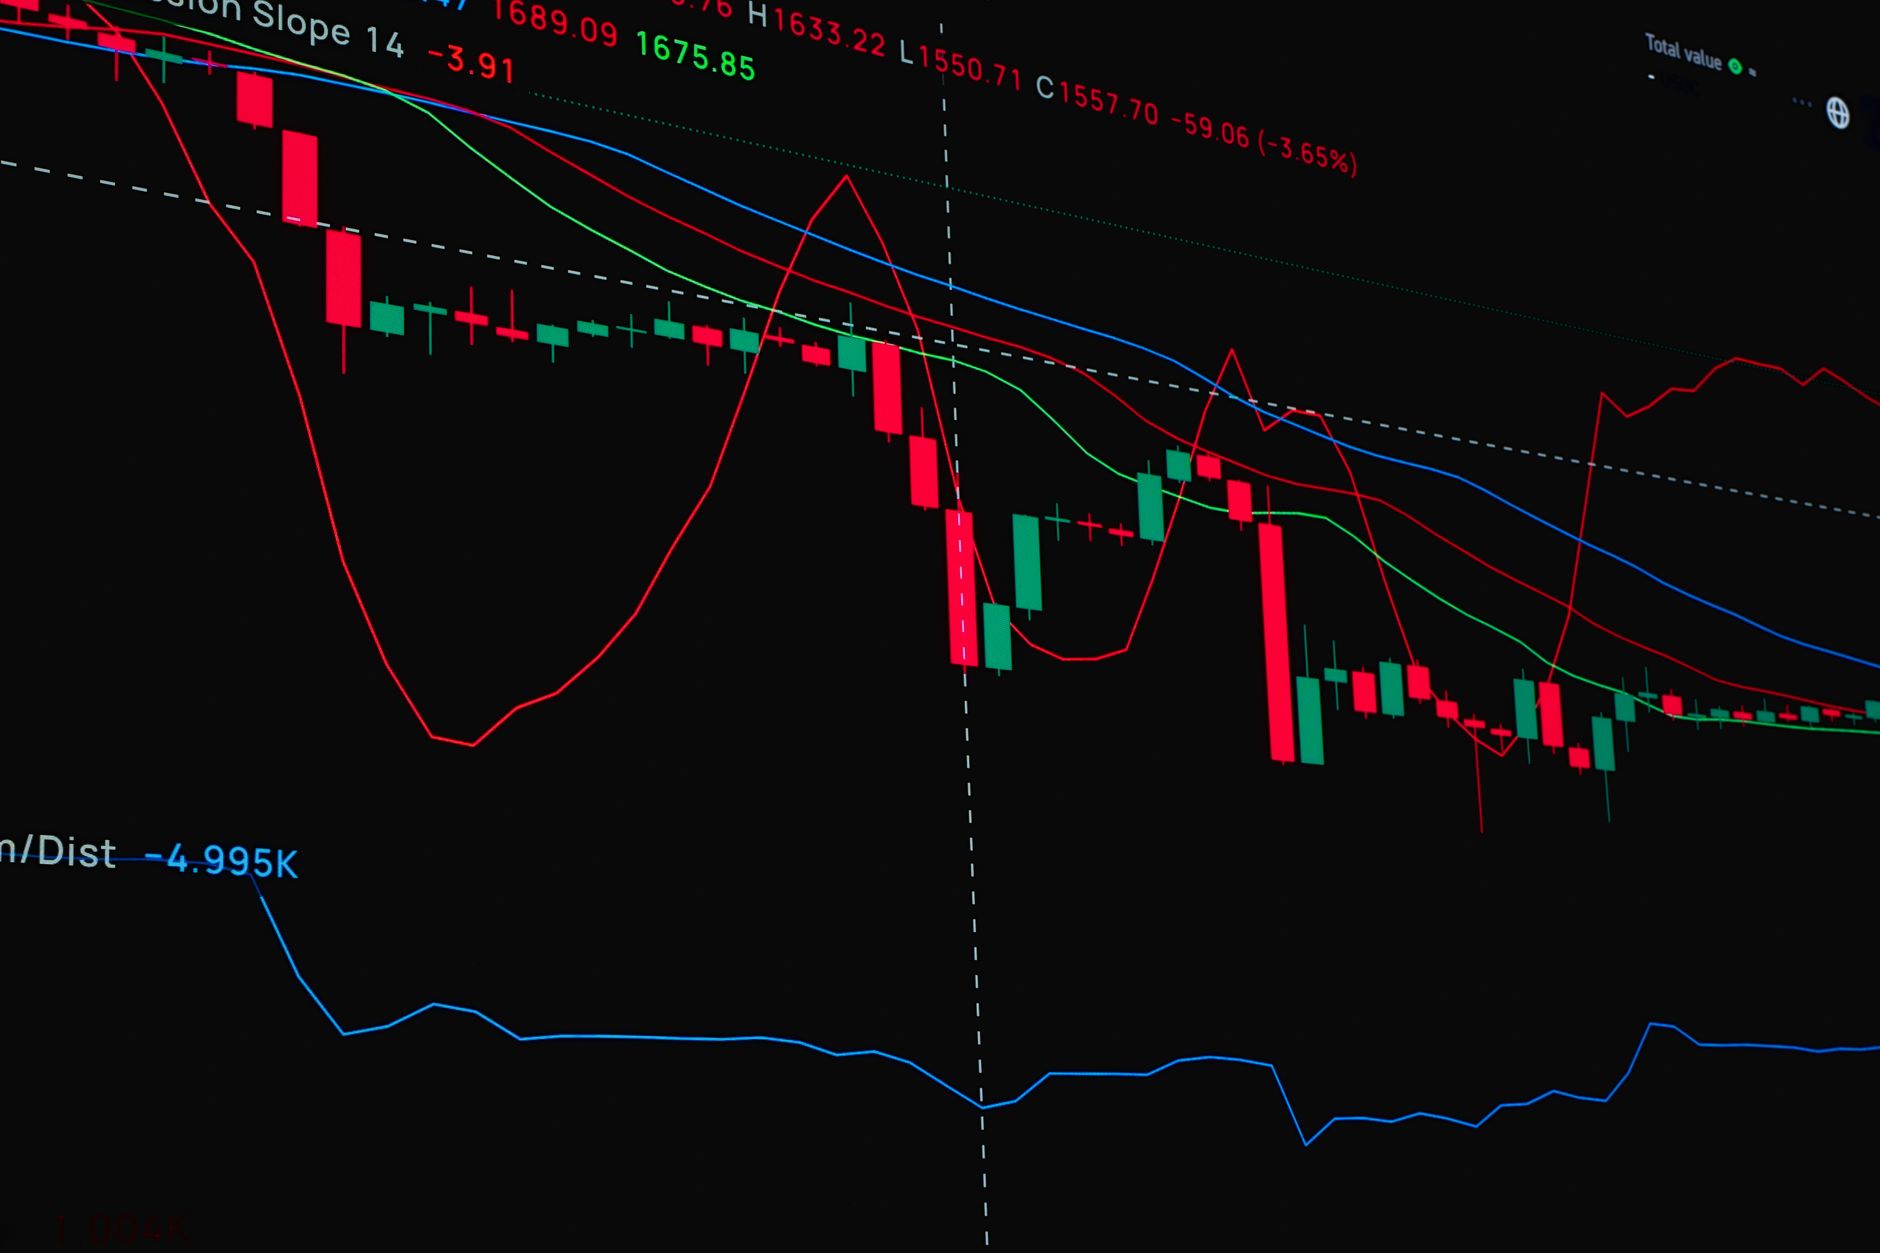
One of the most reliable bullish signals in Ethereum's 2026 chart is the W-shaped recovery pattern. This pattern forms when price tests lows twice (left shoulder, valley, right shoulder), then breaks above the neckline resistance.
Technical breakdown:
- Left Shoulder: Dip to $1,650 (June 2026)
- Valley (Center): Low at $1,620 (July early)
- Right Shoulder: Recovery to $1,750 (July late)
- Neckline: Resistance at $1,850–$1,875
- Breakout Target: W-pattern projects a move to $2,100–$2,200 on breakout confirmation
The pattern confirms on close above $1,925 with volume. Classical technical targets suggest first resistance near $2,150, then $2,400. This aligns closely with consensus forecasts for late 2026.
Price Forecasts: 2026–2030 Consensus
Synthesizing data from major exchanges, research firms, and institutional forecasters:
2026 Year-End Forecast
Consensus Range: $2,400–$2,700
- Base Case: $2,516.65 (28% upside from current)
- Bullish Case: $2,800–$3,000 (49–59% upside)
- Bearish Case: $1,600–$1,800 (14–15% downside)
2027 Forecast
Consensus Range: $2,800–$3,500
- Base Case: $3,100 (64% upside from current)
- Assumes: Dencun scaling improvements bearing fruit, Shanghai staking matures
- Risk: Regulatory pressure on staking or macro recession
2028–2030 Outlook
Range: $3,000–$10,000+ (highly variable)
- Conservative (2030): $3,500–$5,000 (85–165% gain)
- Moderate (2030): $5,000–$7,500 (166–299% gain)
- Optimistic (2030): $8,000–$12,000+ (325–538% gain)
The wide 2028–2030 spread reflects uncertainty about Ethereum's competitive moat. If Layer-2 solutions capture most DeFi activity, mainnet value may plateau. If Ethereum maintains settlement-layer dominance and ETH staking becomes a major institutional asset class, upside accelerates.
Factors Driving Ethereum Valuation
Five macro forces shape Ethereum price over the next 48 months:
1. Staking Yield & Economic Security
Ethereum's proof-of-stake mechanism allows validators to earn 3–5% annual yield. With $25+ billion in ETH staked, the network's economic security is substantial. As institutional investors seek yield in a low-rate environment, staking demand buoys ETH prices. Conversely, if inflation rises and risk-free rates climb above staking yield, institutional interest wanes.
2. Layer-2 Adoption & Fee Dynamics
Optimism, Arbitrum, and Polygon Layer-2s process 30–40% of Ethereum ecosystem volume. As L2s mature, mainnet fee revenue may decline—but L2s also increase ETH's total addressable market. Forecasters monitoring this trade-off often revise predictions based on L2 activity data.
3. Regulatory Clarity
The U.S. SEC's classification of Ethereum as a security vs. commodity remains unresolved. A favorable regulatory regime (e.g., MiCA clarity in Europe) could accelerate institutional adoption; adverse regulation could impose caps. Forecasts hinge on this binary outcome.
4. Macroeconomic Backdrop
Inflation, interest rates, and recession risk shape all risk-asset valuations. If the Fed cuts rates aggressively in 2026–2027, speculative assets (including Ethereum) benefit. If stagflation persists, Ethereum trades lower despite technical improvements.
5. Execution on Proto-danksharding (EIP-4844) & Future Upgrades
The Dencun upgrade improved blob data throughput; Pectra (expected 2026) promises further scalability gains. Each upgrade that materially reduces transaction costs reinforces Ethereum's competitive position and justifies higher valuation multiples.
Expert Predictions vs. Historical Accuracy
Several institutions publish Ethereum forecasts. Here's how they've tracked:
| Forecaster | 2024 Year-End Prediction | Actual (2024 YE) | Accuracy | 2026 Forecast |
|---|---|---|---|---|
| Binance Research | $2,200 | $2,401 | 91.6% (low) | $2,500–$3,000 |
| CoinCodex | $2,000 | $2,401 | 83% (moderate) | $2,600–$2,900 |
| Kraken Intelligence | $1,800 | $2,401 | 75% (low) | $2,400–$2,800 |
| Standard Chartered (2023) | $2,000 (for 2024) | $2,401 | 83% (underestimated) | $5,000+ by 2030 |
Insight: Most forecasters tend to be conservative, underestimating bull runs but capturing downside risks. Kraken's lower 2026 range ($2,400–$2,800) aligns with staking-yield thesis; Standard Chartered's long-dated 2030 call ($5,000+) requires sustained institutional adoption.
Downside Scenarios & Risk Factors
Realistic forecasting requires equal weight to downside. Ethereum could trade to $1,200–$1,500 if:
- Macro Recession: A 2026–2027 recession forces liquidation of risk assets; Ethereum declines 30–50% in unison with equities.
- Regulatory Crackdown: U.S. SEC designates Ethereum a security; institutional staking unwinds; retail adoption collapses.
- Competitive Erosion: Solana or Polkadot (DOT at $0.78 currently) capture majority DeFi share; Ethereum becomes a settlement-layer relic.
- Staking Yield Compression: If validator participation surges, annual yield drops below 2%; staking exodus occurs.
- Technical Issues: A critical smart-contract vulnerability or MEV exploitation crisis damages confidence.
Prudent investors allocate position sizing accordingly: smaller risk-capital for aggressive 2030 upside plays, larger core position for 2026–2027 $2,400–$2,700 range.
On-Chain Metrics & Network Health
Beyond price charts, these metrics validate bullish or bearish narratives:
Active Addresses
Daily active addresses on Ethereum have stabilized around 400,000–500,000, up from 300,000 in 2023. Sustained growth above 600,000 would signal mainstream adoption; decline below 350,000 would suggest deteriorating utility.
Staking Participation
Ethereum now has $25+ billion staked (roughly 21% of circulating supply). For bullish scenario ($5,000+ in 2030), staked ETH should reach 30–40%, indicating institutional conviction. If staking participation plateaus or declines, long-term upside ceilings lower.
Transaction Volume & Gas Fees
Layer-2 solutions are processing 35–45% of Ethereum ecosystem activity. If L2 growth rate accelerates (e.g., capturing 60%+ of volume), mainnet economics shift—potentially negative for ETH price if L2 tokens become primary value accrual vehicles. This dynamic must be monitored quarterly.
DeFi Total Value Locked (TVL)
Ethereum DeFi TVL hovers around $40–$50 billion. Bullish forecasts assume TVL growth to $100+ billion by 2028. If TVL stagnates or migrates to competing chains, 2028–2030 upside contracts significantly.
Ethereum vs. Competing Layer-1 Blockchains
Ethereum's dominance cannot be taken for granted. Compare:
- Solana (SOL): $75.49 current price. Competing on speed (400ms finality) and cost ($0.00025 avg fee). If Solana ecosystem captures 25%+ of DeFi, Ethereum's narrative weakens.
- Polkadot (DOT): $0.78 current price. Positioned as interop hub. Relay-chain model appeals to institutional players; if parachains unlock true cross-chain DeFi, DOT could surge, cannibalizing Ethereum's upgrade premium.
- BNB Chain: $609 current price. Centralized governance but deep CEX liquidity (Binance) and gaming ecosystem. Ethereum forecasts should discount 5–10% probability that BNB becomes dominant Layer-1 by 2030.
Ethereum's advantage remains developer mindshare, security, and DeFi liquidity depth. But forecasters underestimating competitive risk often revise predictions downward when L1 competitors announce major partnerships or upgrades.
Ethereum Network Overview
| Attribute | Details |
|---|---|
| Current Price | $1,882 USD (24h: +0.84%) |
| Market Cap | ~$226 billion USD |
| Consensus Mechanism | Proof-of-Stake (since September 2022) |
| Staked ETH | ~21% of circulating supply ($25+ billion) |
| Active Validators | 900,000+ globally distributed |
| Layer-2 TVL | ~$10–$15 billion (Optimism, Arbitrum, Polygon) |
| Primary Use Cases | DeFi, NFTs, staking, smart contracts, DAO governance |
| Next Major Upgrade | Pectra (2026, tentative) – further scalability improvements |
Frequently Asked Questions
What is Ethereum price forecast based on?
Ethereum price forecasts integrate three inputs: technical analysis (chart patterns, support/resistance), on-chain metrics (staking, transaction volume, active addresses), and macro factors (regulatory clarity, Fed policy, competing blockchains). Reputable forecasts weight all three; hype-driven predictions ignore fundamentals and on-chain data.
How accurate are Ethereum price predictions?
Historical accuracy for 12-month forecasts ranges 75–92%, per the table above. Longer-dated forecasts (2028–2030) carry 35–50% confidence due to uncertainty around regulatory outcomes and competitive dynamics. Treat multi-year predictions as scenarios (base, bull, bear) rather than point estimates.
Is Ethereum price forecast for 2026 realistic?
Yes. The consensus $2,400–$2,700 range for 2026 year-end reflects a 28–43% gain. This is achievable if: (1) Ethereum staking reaches 25%+ participation, (2) Dencun scaling improvements reduce fees, and (3) macro conditions remain neutral (no major recession). However, a 2026 floor of $1,600–$1,800 remains plausible if recession or regulatory headwinds emerge.
Why do Ethereum forecasts vary so much for 2030?
The $3,000–$10,000+ range reflects binary outcomes: If Ethereum maintains Layer-1 dominance and institutional staking grows to $100+ billion, $5,000–$10,000 is justified. If competing L1s fragment the ecosystem and Ethereum becomes a niche settlement layer, $3,000–$4,000 is more realistic. Most forecasters lack conviction on 4+ year outcomes and publish wide ranges accordingly.
Should I invest in Ethereum based on these forecasts?
Forecasts are directional tools, not investment advice. Risk management comes first: Position size your Ethereum holding to volatility tolerance; use stop-losses below $1,700; diversify across Layer-2 opportunities (Optimism, Arbitrum tokens) if you believe in Ethereum ecosystem upside. If macro recession risk seems high, reduce Ethereum exposure regardless of price forecast. Never risk capital you cannot afford to lose on any single crypto forecast.
How do Ethereum staking rewards affect the price forecast?
Staking yield (currently 3–5% APY) attracts institutional capital, supporting price floors. If yield falls below 2% (due to validator surge), holders may dump; if yields rise above 5%, staking demand accelerates, supporting upside. Forecasters monitoring staking participation rates often adjust projections quarterly based on yield dynamics.
The Bottom Line
Ethereum's price forecast landscape separates serious analysis from speculation. The $2,400–$2,700 consensus for 2026 year-end is grounded in technical patterns (W-shaped bullish setup), network growth metrics (staking, active addresses), and macro catalysts (Pectra upgrade, potential Fed cuts). Long-term outlooks ($3,000–$10,000+ by 2030) hinge on execution, regulatory clarity, and Ethereum's ability to maintain competitive moats against Solana, Polkadot, and other Layer-1 platforms.
Risk remains substantial. A 2026–2027 recession, SEC enforcement action, or competitive erosion could drive Ethereum to $1,200–$1,500. Prudent forecasting acknowledges both scenarios and sizes positions accordingly. Track on-chain metrics quarterly—especially staking participation, Layer-2 activity, and validator health—to validate or revise your conviction in consensus price targets.
"Ethereum's long-term valuation depends less on speculative narratives and more on whether the protocol executes on scalability, whether institutional staking becomes permanent capital, and whether competing Layer-1 blockchains can erode its developer moat. These are data-driven questions, not fortune-telling."
— Pro Trader Daily Analysis
Recommended Next Steps
For Traders: Monitor the $1,800–$1,925 range daily. A confirmed breakout above $1,925 on volume targets $2,150–$2,400. Set alerts at $1,750 (support) and $2,000 (psychological resistance).
For Long-Term Investors: Consider staking a portion of Ethereum holdings (3–5% yield). Review staking participation rates and DeFi TVL quarterly to validate 2027–2030 bull-case assumptions.
For Risk-Averse Investors: Diversify across Ethereum core holdings and Layer-2 protocols. A 70% ETH / 30% Optimism + Arbitrum split hedges concentration risk while maintaining exposure to Ethereum ecosystem upside.
For deeper context on crypto market structure and institutional adoption trends, explore more crypto articles on Pro Trader Daily. Related analysis on decentralized finance fundamentals and crypto portfolio allocation strategies can refine your forecast framework further.
External Resources
For real-time Ethereum price data and technical charts, Binance Research publishes curated price predictions and consensus forecasts updated quarterly. Cross-reference with CoinDesk for regulatory and macro-driven analysis that contextualizes technical forecasts.