
How to Read Crypto Fear and Greed Index: Zones and Signals
Traders often check the index only after a move has already happened. Fear spikes after the dump, and greed peaks after the rally. The index becomes useful when you read it as a map of crowd positioning and combine it with price structure. Today's reading shows why: the score has slipped from Greed to Neutral in a week while Bitcoin trades at $80,139, according to real-time market data as of October 27, 2026.
What the Crypto Fear and Greed Index Measures
| Name | Crypto Fear and Greed Index |
|---|---|
| Category | Market sentiment indicator |
| Key features | Single daily score; labeled zones from extreme fear to extreme greed; composite of several market and sentiment inputs |
| Platform | Web dashboards and widgets from several providers |
| Markets | Mainly Bitcoin, with some providers extending to the wider crypto market |
| Update frequency Varies by provider |
According to CoinMarketCap's published index chart, the gauge tracks overall crypto market sentiment on a single scale. Low scores mean fear, and high scores mean greed. Providers differ in inputs and weighting. Common inputs include price volatility, trading momentum and volume, social media activity, and market surveys. Always check the provider's methodology page before treating two indexes as interchangeable.
Today's Reading in Context
A single number says little. The trend says more. The data panel on this page shows the 30-day chart. The key facts:
- Today: 48, officially classified as Neutral.
- Seven days ago: 55, classified as Greed.
- Change: down 7 points in a week.
- 30-day average: 62.
- 30-day high: 74 on October 1, 2026.
- 30-day low: 48 on October 27, 2026, which is today.
- Days in each zone: 23 in Greed, 7 in Neutral, none in Fear, Extreme Fear or Extreme Greed.
- Current streak: 5 consecutive days in Neutral.
Reading: the market spent most of the month in Greed, peaked on October 1, and has been drifting down since. It never reached either extreme. Neutral after a greedy month usually signals that enthusiasm has cooled and traders are waiting for direction. It is not a signal of capitulation. Price is consistent with that: Bitcoin is at $80,139 (24h: 0.30%), Ethereum at $2,327 (24h: 0.57%) and Solana at $100 (24h: -0.79%). There is no panic in these moves.
How to Read Each Zone of the Scale
Providers publish their own numeric cut-offs, so this guide describes zones by behavior rather than fixed numbers. Check your provider's legend for exact boundaries.
Extreme Fear (bottom of the scale)
Selling pressure dominates, volatility is high and headlines are negative. Traders who bought late are capitulating. Some long-term accumulators start paying attention here, on the view that pessimism may already be priced in. It is not a timing signal. Markets can stay in extreme fear while price keeps falling. Scale in; do not go all-in.
Fear
Caution is rising, and dips are being sold rather than bought. This zone suits watchlist building. Look for price to hold a prior support level while the index stops falling. That divergence, where price stabilizes before sentiment recovers, is the setup worth tracking.
Neutral
Neither side has control. Today's 48 falls here. In this zone the index adds little edge, so lean on price structure, volume and your own plan. A Neutral reading after a greedy stretch tells you momentum has faded. A Neutral reading after a fearful stretch tells you sentiment is recovering.
Greed
Buyers are confident, momentum is positive and fear of missing out (FOMO) starts to appear. Trends can run for weeks in this zone. Greed alone is not a sell signal. It is a prompt to tighten risk: trail stops, avoid adding at extended prices and review position sizes. The last 30 days spent 23 days here, and the market kept functioning normally.
Extreme Greed (top of the scale)
Euphoria, heavy social chatter and stretched prices. Risk of sharp pullbacks is higher because few marginal buyers remain. Experienced traders take partial profits and reduce leverage here. Like extreme fear, it can persist longer than expected.
7 Rules for Reading the Index
- Read the direction, not just the level. A move from 55 to 48 in seven days says more than 48 alone.
- Check how long the reading has persisted. Five consecutive days in Neutral is a stable regime. One day in a new zone may be noise.
- Compare to the 30-day average. Today's 48 sits well below the 62 average, so mood is clearly cooler than the recent norm.
- Treat the extremes as alerts, not orders. Extremes tell you to look at price. They do not tell you to trade.
- Look for divergence. Price making new lows while sentiment stops falling, or price making highs while sentiment stalls, are the high-value signals.
- Match the horizon. A daily index suits swing and position decisions. It is too slow for scalping.
- Use one provider consistently. Switching sources mid-analysis mixes methodologies and distorts comparisons.
Where to Access the Index: Provider Comparison
Several sites publish a sentiment index. They are not identical products, so confirm methodology on each site.
| Provider | What it offers | What to check before relying on it |
|---|---|---|
| Alternative.me | Bitcoin-focused index with a history chart and zone labels | Methodology page and zone legend; this article's readings come from here |
| CoinMarketCap | Its own index with an interactive chart on its Fear and Greed Index page | Inputs and scoring may differ from Alternative.me, so values can diverge |
| CoinGlass | Check whether the provider's page shows derivatives data such as funding and open interest | Can be used to pair sentiment with futures positioning |
| Binance Square | Index view with Bitcoin sentiment framing on the Binance Square index page | Confirm source and update timing shown on the page |
If two providers disagree on the same day, that is information. It means the inputs are pulling in different directions. Do not average them. Pick the one whose methodology fits your market, usually Bitcoin-led versus broader crypto.
Practical Trading Scenario
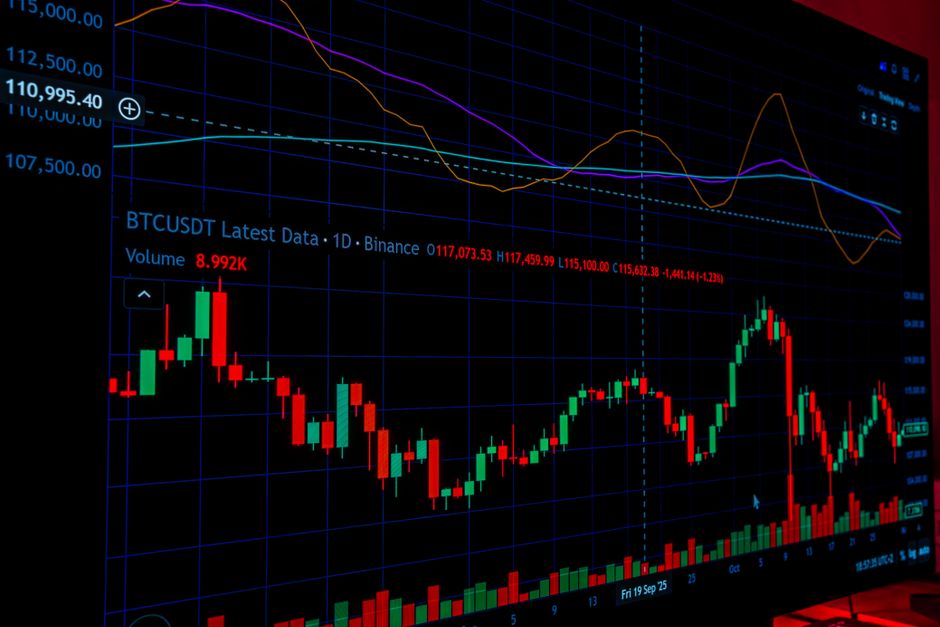
This is an illustration of process, not a recommendation or a prediction.
Setup: Today the index reads 48 (Neutral), down from 55 (Greed). Bitcoin is $80,139. A swing trader who bought during the greedy stretch and holds a profit asks: hold, trim or add?
- Classify the regime. Sentiment has cooled but is not fearful. That argues against aggressive adding and against panic selling.
- Define the trigger. Write down in advance what would change the plan. Examples: the index entering Fear for several consecutive days, or Bitcoin closing below a support level you identified on the daily chart.
- Act on confirmation. If price breaks support while sentiment falls into Fear, cut risk. If price holds support while sentiment falls into Fear, treat it as a possible accumulation zone and add in small tranches.
- Size for being wrong. Risk a fixed, small share of the account per idea. Sentiment extremes can last longer than your margin.
The same logic works in reverse for greed: if the index moves into Extreme Greed while price extends far above its moving averages, trim into strength rather than waiting for a signal that never arrives.
Combining the Index with Technical Indicators
| Indicator | How it pairs with the index |
|---|---|
| Support and resistance | Fear plus a held support level is a stronger setup than fear alone |
| RSI | Oversold RSI with fearful sentiment confirms washed-out conditions; overbought RSI with greed confirms stretch |
| Moving averages | Greed above a rising 50-day or 200-day average is trend-confirming; greed below falling averages is a warning |
| Volume | Rising volume at a sentiment extreme suggests capitulation or blow-off; fading volume suggests exhaustion |
| Funding rates and open interest | Greed plus high funding means crowded longs; fear plus negative funding means crowded shorts |
Why Fear and Greed Work: Behavioral Finance Context
Research from Daniel Kahneman and Amos Tversky on prospect theory indicates that people feel losses more strongly than equivalent gains. That asymmetry explains why fear spreads fast in a drawdown and why traders sell near lows. Crypto adds three amplifiers:
- Loss aversion: holders sell to stop the pain rather than follow a plan.
- FOMO and herd behavior: rising prices and social chatter pull in late buyers at stretched levels.
- Recency bias: after a month of mostly greedy readings, traders assume the next month will look the same.
The index quantifies these crowd behaviors. Its practical value is a check on your own state. If you feel certain, look at the score. If you feel frightened, look at the score. It forces a second opinion before you act on emotion.
Limitations and Criticisms
- It lags. Many inputs are built from recent price action, so the index often confirms a move rather than predicting it.
- Extremes can persist. Contrarian entries made too early are a common failure.
- Methodology differs by provider. The same day can produce different readings.
- It is Bitcoin-heavy. Altcoin cycles can diverge from the headline score.
- Social inputs can be noisy. Bots and coordinated campaigns distort sentiment signals.
- No guarantee of results. Test any rule on your own data before risking capital. This guide makes no backtesting claims.
Setting Up a Monitoring Routine
- Pick one provider and bookmark its page.
- Check once a day at a fixed time. A daily index gives little new information from repeated checks within the same day.
- Log the reading, the zone label and Bitcoin's price in a spreadsheet.
- Flag three events: a zone change, a move of several points in a week, and a reading far from the 30-day average.
- If your charting platform or tracking app supports alerts or widgets for the index, set them for zone changes. Confirm the source before trusting them.
What an Experienced Reader Checks First

One sensible order of checks is as follows. First, the zone label and the date of the reading. Many errors come from comparing a stale screenshot with a live price. Second, the trend over seven and thirty days, which here shows a cooling from a greedy month. Third, price structure on the daily chart. Fourth, derivatives data such as funding rates. A common mistake is trading the label itself, buying because it says Fear or selling because it says Greed. Another is ignoring time horizon: a daily sentiment score is a poor guide for intraday entries. The honest trade-off is that the index is simple, but it carries no edge on its own. Its value comes from forcing a structured pause. For broader market news that explains sentiment shifts, consult a reputable news source.
FAQ
What is the crypto Fear and Greed Index?
It is a daily sentiment score that combines market inputs such as volatility, momentum, volume and social activity into one number and a zone label, from extreme fear to extreme greed.
How to read the crypto Fear and Greed Index?
Check the zone label, the seven-day change and the 30-day average. Today's reading is 48 (Neutral), down 7 from 55 (Greed), against a 30-day average of 62. Then confirm with price structure before acting.
Is it safe to trade on the Fear and Greed Index alone?
No. The index lags price and extremes can persist. Use it as context alongside support and resistance, RSI, moving averages and risk limits.
Why do fear and greed matter in crypto?
Crypto is volatile, so emotions like loss aversion and FOMO can move prices. The index measures that crowd mood, which helps you spot when your own decisions may be emotional.
Why do different providers show different values?
Each provider chooses its own inputs, weighting and update timing. Pick one source and use it consistently.
Related reading: complete crypto guide, crypto market sentiment indicators, dollar-cost averaging in crypto, VIX volatility index explained and more analysis articles.
For a complete overview, see our Best Crypto Exchanges Guide.
Disclosure: Pro Trader Daily and xpertrax.com are operated by the same owner. Links and pop-ups pointing to xpertrax.com promote our own products. This article is for information only and is not financial advice.