Altcoin Season Index Signals Emerging Opportunities Analysis
Traders can discover altseason after a large part of the move has already happened. The index is built to be late by design, and that is exactly why it is useful if you know what it can and cannot tell you. This analysis explains the 75% rule, compares the two common methodologies, maps each index zone to concrete position rules, and sets out where the market stands on October 28, 2026.
How the Index Is Calculated

The index typically looks at the top 100 coins by market cap and compares each one's 90-day price performance against Bitcoin, excluding stablecoins and wrapped tokens. If 75% or more of those coins outperformed Bitcoin, the market is in altcoin season. If 25% or fewer did, it is Bitcoin season. Anything between is a neutral zone.
Recent coverage on Yahoo Finance describes the index as signaling growing momentum beyond Bitcoin. That framing matches how the number behaves: it rises when breadth improves, meaning more coins participate, not just two or three leaders.
Three consequences follow from the construction:
- It is relative, not absolute. If Bitcoin falls 20% and most altcoins fall 15%, the index rises even though almost everything lost money.
- It is lagging. A 90-day window means a coin that surged 80 days ago still counts as an outperformer today.
- It is binary per coin. A coin that beats Bitcoin by 0.1% counts the same as one that beats it by 300%.
Current Reading and Market Context
Recent readings sit in the 52-76 range depending on the tracker and window, which puts the index in the emerging zone and close to the 75 threshold. Bitcoin dominance is around 60%, which is still high. That combination is typical of a market where breadth is improving but Bitcoin still holds the majority of crypto market value.
Here is the price backdrop, using real-time market data as of October 28, 2026:
| Asset | Price (USD) | 24h change |
|---|---|---|
| Bitcoin (BTC) | $81,192 | 0.71% |
| Ethereum (ETH) | $2,358 | 0.63% |
| BNB | $751 | 0.42% |
| Solana (SOL) | $102 | 1.13% |
| XRP | $1.3300 | 0.34% |
| Cardano (ADA) | $0.2048 | -0.17% |
| Dogecoin (DOGE) | $0.0796 | 1.69% |
| Polkadot (DOT) | $1.02 | 1.85% |
| Litecoin (LTC) | $59.20 | 4.48% |
| TRON (TRX) | $0.3294 | -0.05% |
| Chainlink (LINK) | $11.74 | 2.42% |
| Avalanche (AVAX) | $8.95 | 0.78% |
| Uniswap (UNI) | $7.18 | 1.46% |
Two reading notes. First, 24-hour moves say nothing about the 90-day measure the index uses. Litecoin's 4.48% day does not make it an index contributor. Second, the ETH/BTC ratio, derived from the prices above, is about 0.0290, and SOL/BTC is about 0.00126. Rising ratios on those pairs are the clearest coin-level confirmation that an index move is real.
Market cycle stage in 2026
No single indicator defines a cycle stage. What the data supports: Bitcoin dominance near 60% means capital is still concentrated at the top, the index is mid-range rather than extreme, and several large altcoins trade at low absolute prices (ADA at $0.2048, DOGE at $0.0796, DOT at $1.02). That is consistent with a market in a mid-to-early rotation phase, not a late-stage euphoria phase. It is an interpretation, not a measured fact. It would be invalidated if the index reversed below 50 while dominance climbed. For related context on risk appetite, see our risk-on versus risk-off market sentiment analysis.
Top 50 vs Top 100 Methodology
Trackers differ in how many coins they sample, which window they use, and what they exclude. The same market can therefore produce readings that differ by many points on the same day. That is the main reason the "current value" is a range, not a single number.
| Feature | Top 50 version | Top 100 version |
|---|---|---|
| Sample | Larger, more liquid coins only | Includes mid-cap coins |
| Sensitivity | Each coin carries more weight, so readings can jump | Smoother, each coin carries less weight |
| Liquidity of sample | Generally easier to trade | Includes thinner order books |
| Bias | Reflects large-cap rotation | Captures broader speculative breadth |
| Best use | Tradeable-universe check | Breadth and sentiment check |
| Exclusions | Stablecoins and asset-backed tokens, per tracker rules | Stablecoins and wrapped tokens, per tracker rules |
Practical approach: check both. If the top 50 reading is well above the top 100 reading, rotation is concentrated in large caps, and your tradeable universe is narrower. If the top 100 leads, speculation is spreading into small caps, which historically means higher volatility and worse liquidity when conditions turn.
Historical Precedent for 75+ Readings
The honest summary is qualitative, because published index values vary by tracker and I will not cite precise returns I cannot verify. Readings above 75 have clustered near the later stages of strong crypto bull phases, notably around the early 2018 and 2021 peaks. In both cases, altcoin drawdowns that followed were typically far deeper than Bitcoin's.
What this tells you:
- A 75+ reading is a late-stage condition more often than an early one.
- The profitable window is usually in the climb through the 50-75 zone, not after the threshold is crossed.
- The index does not predict the top. It confirms that breadth is already extreme, which is when risk is asymmetric to the downside.
Prediction-accuracy rates for the index, such as hit rate by zone, are not published by trackers in a form I can verify. Anyone quoting a precise success percentage should show the dataset behind it.
Trading Signals by Index Zone
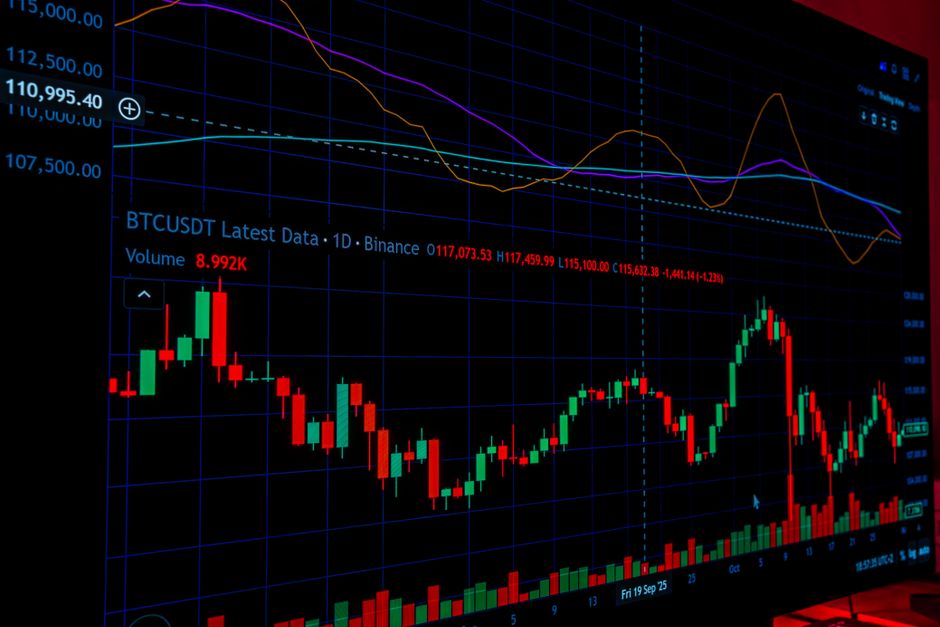
The framework below is illustrative and has not been backtested. It converts the index zone into an exposure cap and a behavior rule. The percentages are example parameters you can adjust, not performance claims.
| Zone | Regime | Altcoin exposure cap (example) | Entry rule | Exit rule |
|---|---|---|---|---|
| 0-25 | Bitcoin season | Minimal | Watchlist only | Cut weak holdings that trail BTC |
| 30-50 | Neutral, Bitcoin-leaning | Small starter allocation | Only coins with rising pair ratio versus BTC | Exit on a close below your invalidation level |
| 50-75 | Emerging altseason | Moderate, scaled in stages | Add on pullbacks in coins passing screening criteria | Trail stops; take partial profits at pre-set targets |
| 75+ | Altseason (late-stage risk) | Reduce, do not add | No new speculative entries | Sell in tranches; exit more if index falls back below 75 while dominance rises |
Rules for the 50-75 zone (where the index is now)
- Split intended altcoin exposure into three tranches. Deploy the first only when a coin shows relative strength versus BTC.
- Deploy the second on a pullback that holds a prior support level, not on a breakout candle.
- Hold the third in reserve until the index confirms by staying in the zone for several weekly readings.
- Write the invalidation level before entry. If the trade has no stated exit, it is not a trade.
- Reassess when the index crosses 70. Proximity to 75 is when profit-taking plans should be finalized, not started.
Cross-checks that improve the signal
- Bitcoin dominance: a falling trend alongside a rising index is stronger confirmation than either alone. See this Bitcoin dominance explained guide.
- ETH/BTC: altseason rarely sustains without Ethereum outperforming Bitcoin.
- Macro and liquidity: rate expectations and broad risk appetite affect all speculative assets. Check Reuters for central bank and macro headlines before sizing up.
7 Screening Criteria for Emerging Altcoin Opportunities
The index tells you the regime. These criteria select candidates. Apply all of them; failing two or more means skip the coin.
- Relative strength versus BTC: the coin's own pair ratio should be rising over 30 and 90 days, not just its dollar price.
- Liquidity: check order-book depth on your exchange. If a modest order moves the price, the coin is too thin for your size.
- Market cap tier: large caps like ETH, BNB, SOL and XRP behave differently from sub-$1B tokens. Match the tier to your risk limit.
- Supply and unlocks: look up scheduled token unlocks and emissions. Heavy upcoming supply works against price.
- Real usage: on-chain activity, fees generated, or active developers. Prefer projects whose usage data can be verified independently.
- Drawdown structure: prefer coins forming higher lows over coins in a vertical move. Chasing a vertical candle gives you the worst entry.
- Exit clarity: you can state, in one sentence, the price or event that proves you wrong.
Risk Management Rules
| Risk | Control |
|---|---|
| Index lag | Use shorter-window pair ratios as confirmation; do not rely on the 90-day reading alone |
| Concentration | Set a maximum per-coin allocation before buying, and keep it fixed |
| Illiquidity on exit | Size positions to what the order book can absorb in a fast sell-off |
| Euphoria near 75+ | Pre-commit to tranche selling; do not decide in the moment |
| Relative-only gains | Track dollar P&L as well, since the index can rise during a falling market |
| Leverage | Altcoin volatility magnifies liquidation risk; spot positions give you room to be wrong |
For sizing mechanics, review crypto position sizing and risk management and stop-loss strategies for volatile altcoins.
Practical Notes and Common Errors

Several recurring mistakes come from misreading how the index is built:
- Comparing readings across trackers. A 62 on one site and a 55 on another may both be correct, because the sample size, window and exclusions differ. Pick one or two sources and stay consistent.
- Treating 75 as a buy signal. It is a label for a condition that already happened. Entries are better planned during the climb, with exits planned near the threshold.
- Ignoring stablecoin and wrapped-token exclusions. Bitcoin dominance figures that include stablecoins in total market cap can read differently from the index's own sample, so do not mix definitions in the same analysis.
- Reading a single day. The index uses a trailing 90-day window and moves slowly. Weekly readings are more useful than daily ones.
- Skipping the trade-off. Waiting for confirmation costs you the first part of a move. Entering early risks a false start. Staged entries are the compromise, and they work only if the stop rules are written down in advance.
For a broader view of how this fits into portfolio construction, browse the crypto analysis hub and the complete fintech research guide.
FAQ
What is the altcoin season index?
It is a 0 to 100 gauge showing what share of top altcoins outperformed Bitcoin over a trailing window, usually 90 days. A reading of 75 or higher is labeled altcoin season, and 25 or lower is Bitcoin season.
How to use the altcoin season index in a trade plan?
Treat it as a regime filter. Use the zone to set how much altcoin exposure is allowed, then use coin-level screening, position sizing and stop rules to pick and manage individual trades.
Is it safe to trade based on the altcoin season index alone?
No. The index is lagging and backward-looking. It says nothing about liquidity, token supply, or the risk of any single coin, so it should never be the only input to a trade. Crypto assets can lose most of their value, and nothing here is financial advice.
Why does Bitcoin dominance matter for altcoin season?
Falling dominance means altcoins are taking a larger share of total crypto market value. The index and dominance measure related but different things, so traders compare both. Dominance near 60% alongside a mid-range index points to a market still led by Bitcoin.
More on this topic: more crypto trading articles, and DeFi market analysis for protocol-level screening data.