
Professional Day Trading Earnings: The Truth About Pay
Most people who quit a job to trade full time are comparing themselves to the wrong benchmark. They picture the $90K-$178K salary ranges that are published online. This guide shows the failure data, the arithmetic behind realistic returns, and what is left after costs, tax and hours worked.
What the research says about day trader profits

| Claim | Source type | How to treat it |
|---|---|---|
| 97% of persistent traders lost money | — | — |
| 10-many traders are profitable | Commonly cited industry estimate | No standard audit or definition; treat as an upper bound |
| $90K-$178K salary range | Published salary estimates | — |
| 1-4% monthly return benchmark | Common educator and trader target | A planning range, not a guarantee; many months are negative |
| $25,000 minimum | FINRA pattern day trader rule | Regulatory floor for US margin accounts; confirm current rule text before funding |
For background on the mechanics, according to Investopedia's day trading primer, day trading means opening and closing positions within the same session and typically relies on margin, which magnifies both gains and losses.
Salary ranges versus self-funded reality
The $90K-$178K figure circulates widely. It is a published salary range, and it may not reflect what a self-funded retail trader can expect. A self-funded retail trader has no base salary. Income is the net result of the account after every cost, and in a losing year it is negative.
This is the central point of the whole topic: a salary is paid regardless of results, while trading earnings are a residual. Residuals are volatile, and they arrive after the broker, the exchange, the data vendor and the tax authority take their share.
Account size and the return math
Account size correlates with income for a simple reason: returns are percentages, and bills are fixed dollars. A 2% month on $25,000 is $500. The same 2% on $250,000 is $5,000. The table below is straight arithmetic, not observed results. It shows the capital needed to generate a given gross annual income at a steady monthly return, ignoring compounding, costs and tax.
| Target gross income | Capital at 1% monthly | Capital at 2% monthly | Capital at 4% monthly |
|---|---|---|---|
| $90,000 per year | $750,000 | $375,000 | $187,500 |
| $178,000 per year | about $1,483,000 | about $742,000 | about $371,000 |
Now the same math in reverse, starting from the $25,000 minimum.
| Monthly return on $25,000 | Gross per month | Gross per year (simple) |
|---|---|---|
| 1% | $250 | $3,000 |
| 2% | $500 | $6,000 |
| 4% | $1,000 | $12,000 |
A trader starting at the legal minimum cannot replace a salary even if the 1-4% benchmark holds every single month. That is one reason traders may be tempted to take oversized positions, which magnify losses.
7 factors that decide professional day trading earnings
- Starting capital. It sets the dollar value of every percentage point. Under-capitalized traders feel pressure to trade larger than their edge supports.
- Edge and expectancy. Profit per trade, averaged over many trades, must be positive after costs. Without a written, tested rule set, there is no edge to measure.
- Risk per trade. Capping loss on any single trade at a small fixed fraction of equity keeps one bad day from ending the business.
- Transaction costs. Commissions, spreads, slippage, platform fees and market data subscriptions add up. High-frequency styles are the most cost-sensitive.
- Tax treatment. Short-term gains are taxed as ordinary income in the US. Wash-sale rules can defer loss deductions.
- Time and consistency. Full-session focus is demanding. Inconsistent attendance usually means inconsistent results.
- Psychology. Revenge trading, moving stops and oversizing after wins erode a working strategy faster than a bad market does.
Net earnings: fees, tax and a worked example
Gross profit is not income. The example below is hypothetical. The cost and tax inputs are assumptions you should replace with your own, and they are not data from any specific trader.
| Line item | Assumption | Amount |
|---|---|---|
| Account size | $25,000 | n/a |
| Gross return | 2% per month, simple | $6,000 |
| Platform, data and fees | Assumed $1,200 per year | -$1,200 |
| Taxable profit | Gross minus costs | $4,800 |
| Federal tax | Assumed 22% bracket, state tax ignored | -$1,056 |
| Net to the trader | After costs and federal tax | $3,744 |
That is a good year in this scenario. A flat year still costs the $1,200, and a losing year may offer only limited deductions against other income. US traders who qualify for trader tax status can consider a mark-to-market election, which changes how gains and losses are treated. It has strict qualification rules and a filing deadline, so confirm it with a tax professional. Tax rules differ sharply outside the US, and so do leverage limits and account minimums, so check your own country's regulator and tax authority. For US-specific rules, see the U.S. Securities and Exchange Commission. Our day trading taxes guide goes deeper on reporting.
Time investment versus earnings
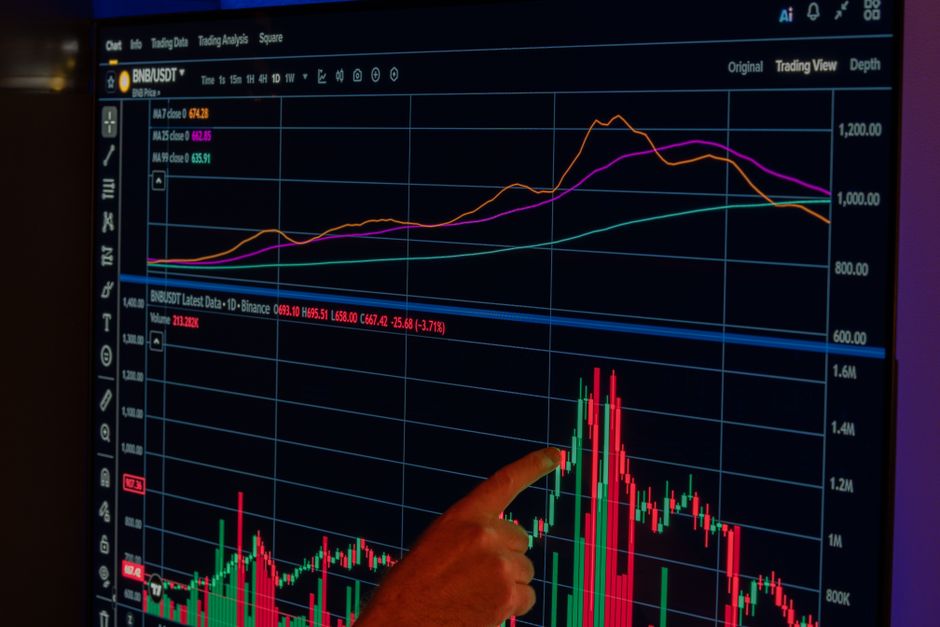
US markets have roughly 252 trading days per year. A trader who works five hours a day, including preparation and review, puts in about 1,260 hours. Dividing the earlier results by that figure gives an hourly view.
| Scenario | Annual figure | Hours | Per hour |
|---|---|---|---|
| 1% monthly, gross on $25,000 | $3,000 | 1,260 | about $2.38 |
| 2% monthly, gross on $25,000 | $6,000 | 1,260 | about $4.76 |
| 4% monthly, gross on $25,000 | $12,000 | 1,260 | about $9.52 |
| Worked example, net of costs and tax | $3,744 | 1,260 | about $2.97 |
These numbers assume every month is profitable. Add losing months and the hourly rate drops further. The hourly rate improves mainly through account size, not through more screen time.
Strategy comparison
No strategy has a published, audited earnings rate for retail traders. The table compares qualitative characteristics only.
| Style | Time demand | Cost sensitivity | Main risk |
|---|---|---|---|
| Scalping | Very high, constant attention | Very high; spreads and fees dominate | Small edge erased by costs and errors |
| Momentum trading | High, concentrated around the open | Moderate to high | Chasing moves, sharp reversals |
| Mean reversion | Moderate | Moderate | Fading a trend that keeps going |
| Futures day trading | High | — | Built-in borrowed exposure magnifies losses |
The psychological cost
Income volatility is a stress load most salaried people never carry. Results arrive as a jagged line: a strong week, then a drawdown that wipes out a month. Common patterns include revenge trading after a loss, widening a stop to avoid being wrong, and increasing size after a streak. Each of these breaks the risk rules that made the strategy viable on paper.
There is also a financial-planning cost. If rent depends on this month's profit, you will be tempted to force trades on slow days. As a rule of thumb, keep living expenses separate from the trading account and hold a reserve of several months of expenses.
Decision framework: trading versus a job
| Your situation | Reasonable approach |
|---|---|
| Under $25,000 and no savings buffer | Keep your job. Paper trade or use a cash account with limited trades while you build a record. |
| $25,000 to trade, stable job | Trade part time with money you can afford to lose. Track every trade for at least a year. |
| Large capital, 12+ months of expenses saved | Full-time trading becomes a possible business, but only after a documented positive expectancy. |
| Trading income is needed for bills | Do not rely on it. Consider a role at a regulated trading firm or a related job instead. |
How to avoid being in the 97%
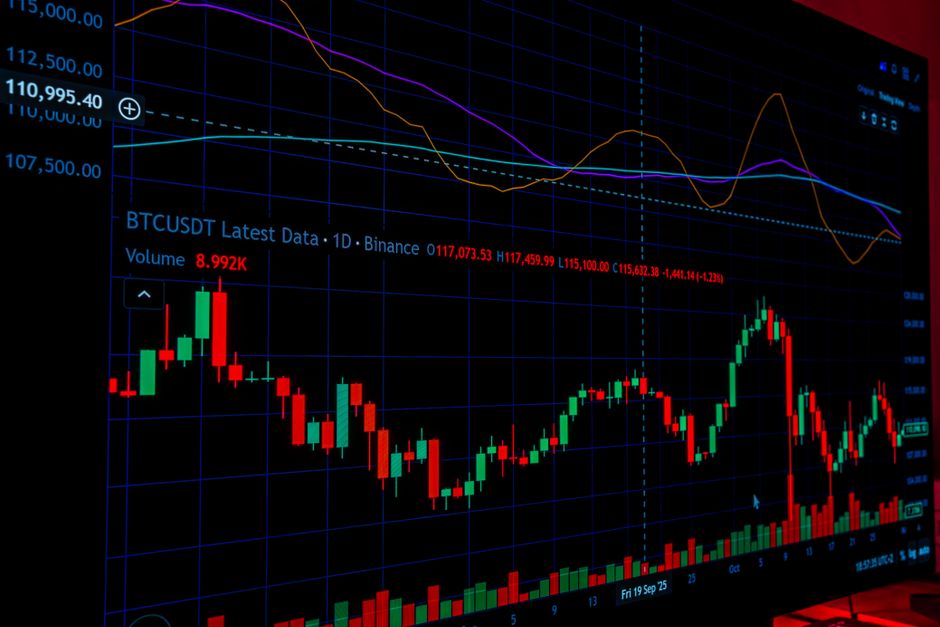
What expert practice looks like. The pattern day trader rule applies to margin accounts. Once you are designated a pattern day trader, the account must maintain $25,000 in equity. Rules can change, so confirm the current requirements and your broker's policy before funding an account. A common mistake is dropping below the minimum after a loss, which restricts the account until it is restored. Another is trading without a written plan, which makes it impossible to tell skill from luck. The fix for most errors is mechanical: fixed risk per trade, a daily loss limit that ends the session, and a trade journal reviewed weekly.
- Trade a simulator or very small size until you have a long enough record to calculate expectancy after costs.
- Set a daily loss limit and honor it, even when a setup looks perfect.
- Compare brokers on all-in cost, not just commission. See the best brokers for day trading breakdown.
- Build your day trading risk management rules before your first live trade.
- Set aside money for taxes as you go, so a profitable year does not become a cash crunch.
For wider context, browse the trading section and the complete fintech guide.
FAQ
What is professional day trading earnings?
It is the net income a trader keeps from buying and selling within the same session, after losses, fees, data costs and taxes. Published salary figures of $90K-$178K may not reflect what self-funded retail accounts earn.
How to estimate realistic day trading income?
Multiply account size by a conservative monthly return, subtract annual costs, then apply your tax rate. A 1-4% monthly benchmark on $25,000 gives $3,000 to $12,000 gross per year before costs and tax, if every month is profitable.
Is it safe to day trade for a living?
It is high-risk. A commonly cited failure rate for day traders is about 97%. It is safer as a part-time activity funded with money you can afford to lose.
Why do 97% of day traders fail?
Common causes are no tested edge, oversized positions, costs that exceed a small edge, and emotional decisions after losses.
For a complete overview, see our Crypto Trading Strategies Guide.
Disclosure: Pro Trader Daily and xpertrax.com are operated by the same owner. Links and pop-ups pointing to xpertrax.com promote our own products. This article is for information only and is not financial advice.