
Is AI Crypto Trading Profitable? What the Evidence Shows
Maybe, but rarely in the way the YouTube thumbnails promise. You see a screenshot with a 300% return, you pay for a subscription, and three weeks later your balance is lower than where it started.
Bitcoin trades at $75,173 and Ethereum at $2,142, according to real-time market data as of November 9, 2026, with ETH down 4.11% in 24 hours. Moves like that are exactly where a bot either earns its keep or bleeds fees. This guide shows how to tell which, with the arithmetic laid out so you can run your own numbers.
Key finding: Quantified failure-rate data for retail AI crypto bots is hard to find, and most available results are anecdotal. Anyone quoting a precise "X% of bots lose money" figure is guessing. Bot-specific proof has to come from your own live, fee-inclusive results.
What the Evidence Says About Profitability

For a plain-language overview of how these tools work, including the difference between rule-based and machine-learning bots, see this beginner explainer according to Kraken Learn.
What "AI" usually means in a bot
| Bot type | How it decides | Typical weakness |
|---|---|---|
| Grid bot | Places buy and sell orders at fixed price intervals | Loses in strong one-way trends |
| DCA bot | Buys at set intervals or on dips | Accumulates losses in prolonged downtrends |
| Indicator or signal bot | Trades on RSI, moving averages and similar rules | Overfitted to past data |
| Machine-learning bot | Model trained on historical price and sometimes sentiment data | Model decay when market behavior shifts |
| Copy or "signal" bot | Mirrors another trader's or provider's trades | Opaque track records, delayed execution |
"AI" is a marketing label on most of these products. Ask what the model predicts, what data it uses, and how it was validated on data it never saw.
7 Reasons AI Trading Bots Lose Money
- Fees compound with trade frequency. A bot that trades often pays the exchange on every order. The next section shows the math.
- Slippage. Market orders fill worse than the quoted price, especially in thin altcoin pairs or during volatile moves like today's ETH drop.
- Overfitting. The strategy is tuned to history, not to a repeatable pattern.
- Regime change. A bot built for a range-bound market fails in a trend, and vice versa.
- Subscription drag. Fixed monthly fees hurt small accounts disproportionately.
- No stop discipline. Many bots keep averaging down because the setting says so, turning a drawdown into a wipeout.
- Counterparty and scam risk. Some "bots" are Ponzi-style schemes or require you to hand over deposit or withdrawal access.
Cost Breakdown: Fees vs Returns
Costs are the one part of this you can calculate. The table below uses assumed inputs for illustration, not quoted prices from any platform: a 0.10% fee per side, 0.05% slippage per side, and a $50 monthly subscription on a $5,000 account. Check your own exchange fee tier and bot plan, then substitute your figures.
| Cost item | Formula | Low-frequency (10 round trips/month) | High-frequency (60 round trips/month) |
|---|---|---|---|
| Exchange fees (0.20% per round trip) | trades x 0.20% x capital | 2.0% = $100 | 12.0% = $600 |
| Slippage (0.10% per round trip) | trades x 0.10% x capital | 1.0% = $50 | 6.0% = $300 |
| Subscription | fixed | 1.0% = $50 | 1.0% = $50 |
| Total monthly cost | — | 4.0% = $200 | 19.0% = $950 |
Read that last row carefully. Under these assumptions, the high-frequency bot must earn 19% gross every month just to break even. That is why "it trades 60 times a month" is a warning, not a selling point. Maker orders, exchange-token discounts and volume tiers can cut fees, but slippage and subscriptions remain.
DIY break-even formula
Required monthly gross return = (round trips per month x round-trip cost %) + (subscription / capital). Round-trip cost is two fees plus two slippage estimates. Run this before paying for any bot.
Three Worked Scenarios
These are hypothetical scenarios built on stated assumptions, not real accounts or published results. They show how the same strategy outcome changes once costs are included. Real-world case studies with audited statements are rare, and a vendor that offers only screenshots is not providing evidence.
Scenario A: The high-frequency retail bot (unprofitable)
A $5,000 account runs a signal bot at 60 round trips per month with the costs from the table above. Even if the strategy has a small genuine edge, the 19% monthly cost hurdle swallows it. The likely result is a steady decline that looks like "bad luck" in the dashboard but is mostly fees.
Scenario B: The low-frequency trend follower (can be profitable)
A self-run, rules-based trend bot makes 12 round trips a year with no subscription. At 0.30% all-in cost per round trip, annual cost is 3.6%. Suppose the strategy earns 18% gross in a good year; net is about 14.4% before tax. The unknown is the gross edge, which can be negative in range-bound years, and drawdowns in crypto can be severe. Low costs make profit possible, not likely.
Scenario C: The marketed backtest vs live (break-even at best)
A vendor shows a backtest of +40% gross over a year with 100 round trips and no costs modeled. Apply 0.30% per round trip: 30% cost. Add a $600 annual subscription on $5,000 (12%). Net: 40% - 30% - 12% = -2%, and that still assumes live execution matches the backtest, which it rarely does.
| Scenario | Gross return (assumed) | Costs (assumed) | Net |
|---|---|---|---|
| A: High-frequency | Unknown edge | 19% per month | Negative unless gross edge exceeds 19% monthly |
| B: Low-frequency | 18% | 3.6% | About +14.4% before tax |
| C: Marketed backtest | 40% | 42% (30% trading + 12% subscription) | About -2% |
Backtest vs Live Performance: Why They Diverge
| Factor | In the backtest | In live trading |
|---|---|---|
| Fees | Often omitted or understated | Charged on every order |
| Fills | Assumed at the candle close or the exact signal price | Partial fills, queue position, slippage |
| Data | Parameters tuned on the same history that is tested | New, unseen data |
| Survivorship | Tests only coins that still exist | Delisted and collapsed tokens are a real risk |
| Latency and outages | None | API errors, exchange downtime, rate limits |
| Behavior | Strategy never switched off | Users intervene after drawdowns |
The fix is out-of-sample testing: lock parameters, test on data the model never saw, then paper trade or run tiny live size for at least a few weeks. For a method, see this backtesting trading strategies guide.
Risk Management That Works for Bots
- Size small first. Start with an amount you can lose entirely. Scale only after live results, net of every fee, beat holding the asset.
- Benchmark against buy-and-hold. If your bot loses to simply holding BTC at $75,173 or ETH at $2,142 over the same period, it is not adding value.
- Cap per-trade and total loss. Set a hard stop at the account level, for example a maximum drawdown after which the bot is switched off and reviewed.
- Limit API permissions. Enable trading only. Disable withdrawals and use IP whitelisting where the exchange offers it.
- No margin until proven. Margin amplifies losses; bots that average down with margin are how accounts get liquidated.
- Prefer liquid pairs. BTC and ETH pairs have tighter spreads than small caps. Thin books raise slippage.
- Log everything. Export trade history monthly and compute net return yourself, including fees and subscription.
More on position sizing and drawdown limits is in the crypto risk management guide.
Red Flag Checklist for Scam Bots
- Guaranteed or fixed daily, weekly or monthly returns.
- Requests that you deposit funds into the vendor's wallet or account instead of your own exchange account.
- Withdrawal permissions required on your API key.
- Referral or recruitment rewards are the main selling point.
- No named team, no registered company, no verifiable track record.
- Performance shown only as screenshots or edited videos, never as exchange-verified statements.
- Pressure tactics: countdown timers, "limited slots", or private chat groups pushing you to add funds.
- Vague claims of "proprietary AI" with no description of data, method or validation.
- Fees for withdrawing your own money.
As a rule of thumb, if even one of these applies, treat it with serious suspicion and consider walking away. Compare any vendor's claims against exchange fee schedules on the crypto exchange fees comparison before paying anyone.
Practical Notes from the Trading Desk
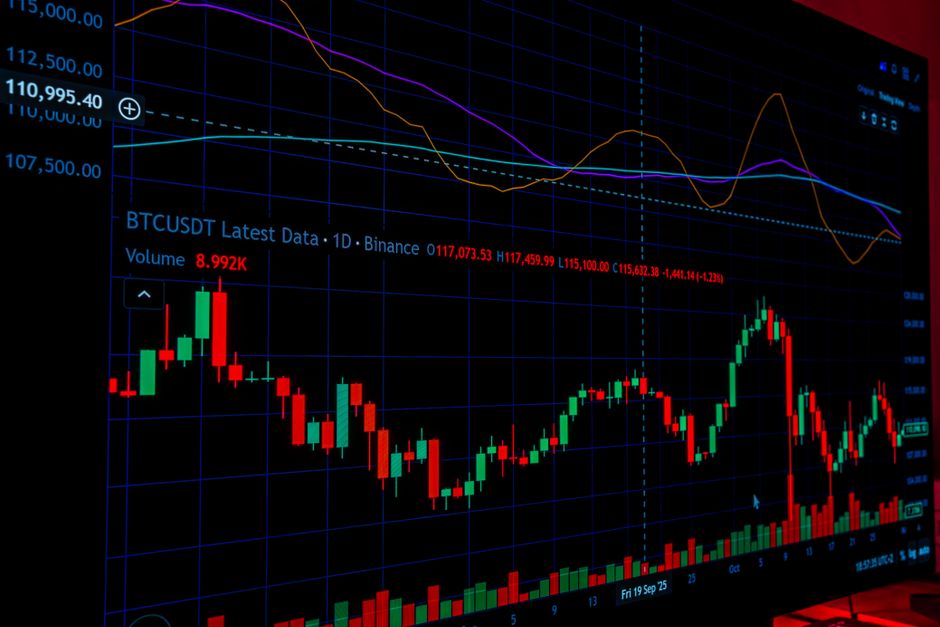
Common errors with bots are mundane. Users set a grid range too narrow, price leaves it, and the bot sits idle holding a losing position. Others forget that exchange fee tiers can change with trading volume, so a bot's churn can look cheap until the tier changes. API keys created with withdrawal enabled are the most dangerous setup mistake, and rotating the key is the fix. Tax is the other overlooked cost: in many jurisdictions every bot trade is a taxable event, so hundreds of small trades create hundreds of line items to report. Prices also move fast: ETH is down 4.11% and XRP 3.85% in 24 hours at the time of writing, with SOL at $87.47 down 2.12%. A bot configured last month may be operating outside the volatility it was built for. Check live quotes via CoinGecko before changing parameters. The honest trade-off is automation discipline against hidden costs and model decay. For a wider view of strategy choices, see the crypto trading bot guide.
FAQ
What is AI crypto trading?
It is the use of software that places crypto trades automatically based on rules or a machine-learning model. The software executes a strategy faster and without emotion, but it does not guarantee that the strategy has an edge.
Is AI crypto trading profitable for beginners?
Usually not reliably. Beginners can easily end up with high-frequency bots, high fees and unvalidated strategies. Bots automate a strategy but do not remove the problem of costs eating into returns.
How to test whether a bot is profitable?
Run it on paper trading or very small live size for several weeks. Export every trade, subtract exchange fees, slippage and subscription, then compare the net result with buy-and-hold over the same dates.
Is it safe to give a trading bot access to my exchange account?
Only with trade-only API permissions, withdrawals disabled and IP whitelisting if available. Never send funds to a bot vendor's wallet, and never share your login or seed phrase.
Why do bots that backtested well lose money live?
Backtests often ignore fees and slippage, tune parameters on the same data they test, and assume perfect fills. Live markets add costs, outages and regime shifts that the test never saw.
Related reading
- Complete crypto guide hub
- More trading articles
- Weekly crypto market analysis
This article is educational and not financial advice. Crypto trading carries a risk of total loss. Prices are real-time market data as of November 9, 2026.
Disclosure: XPERTRAX (xpertrax.com) is an affiliated platform. Links and pop-ups pointing to xpertrax.com promote it. This article is for information only and is not financial advice.