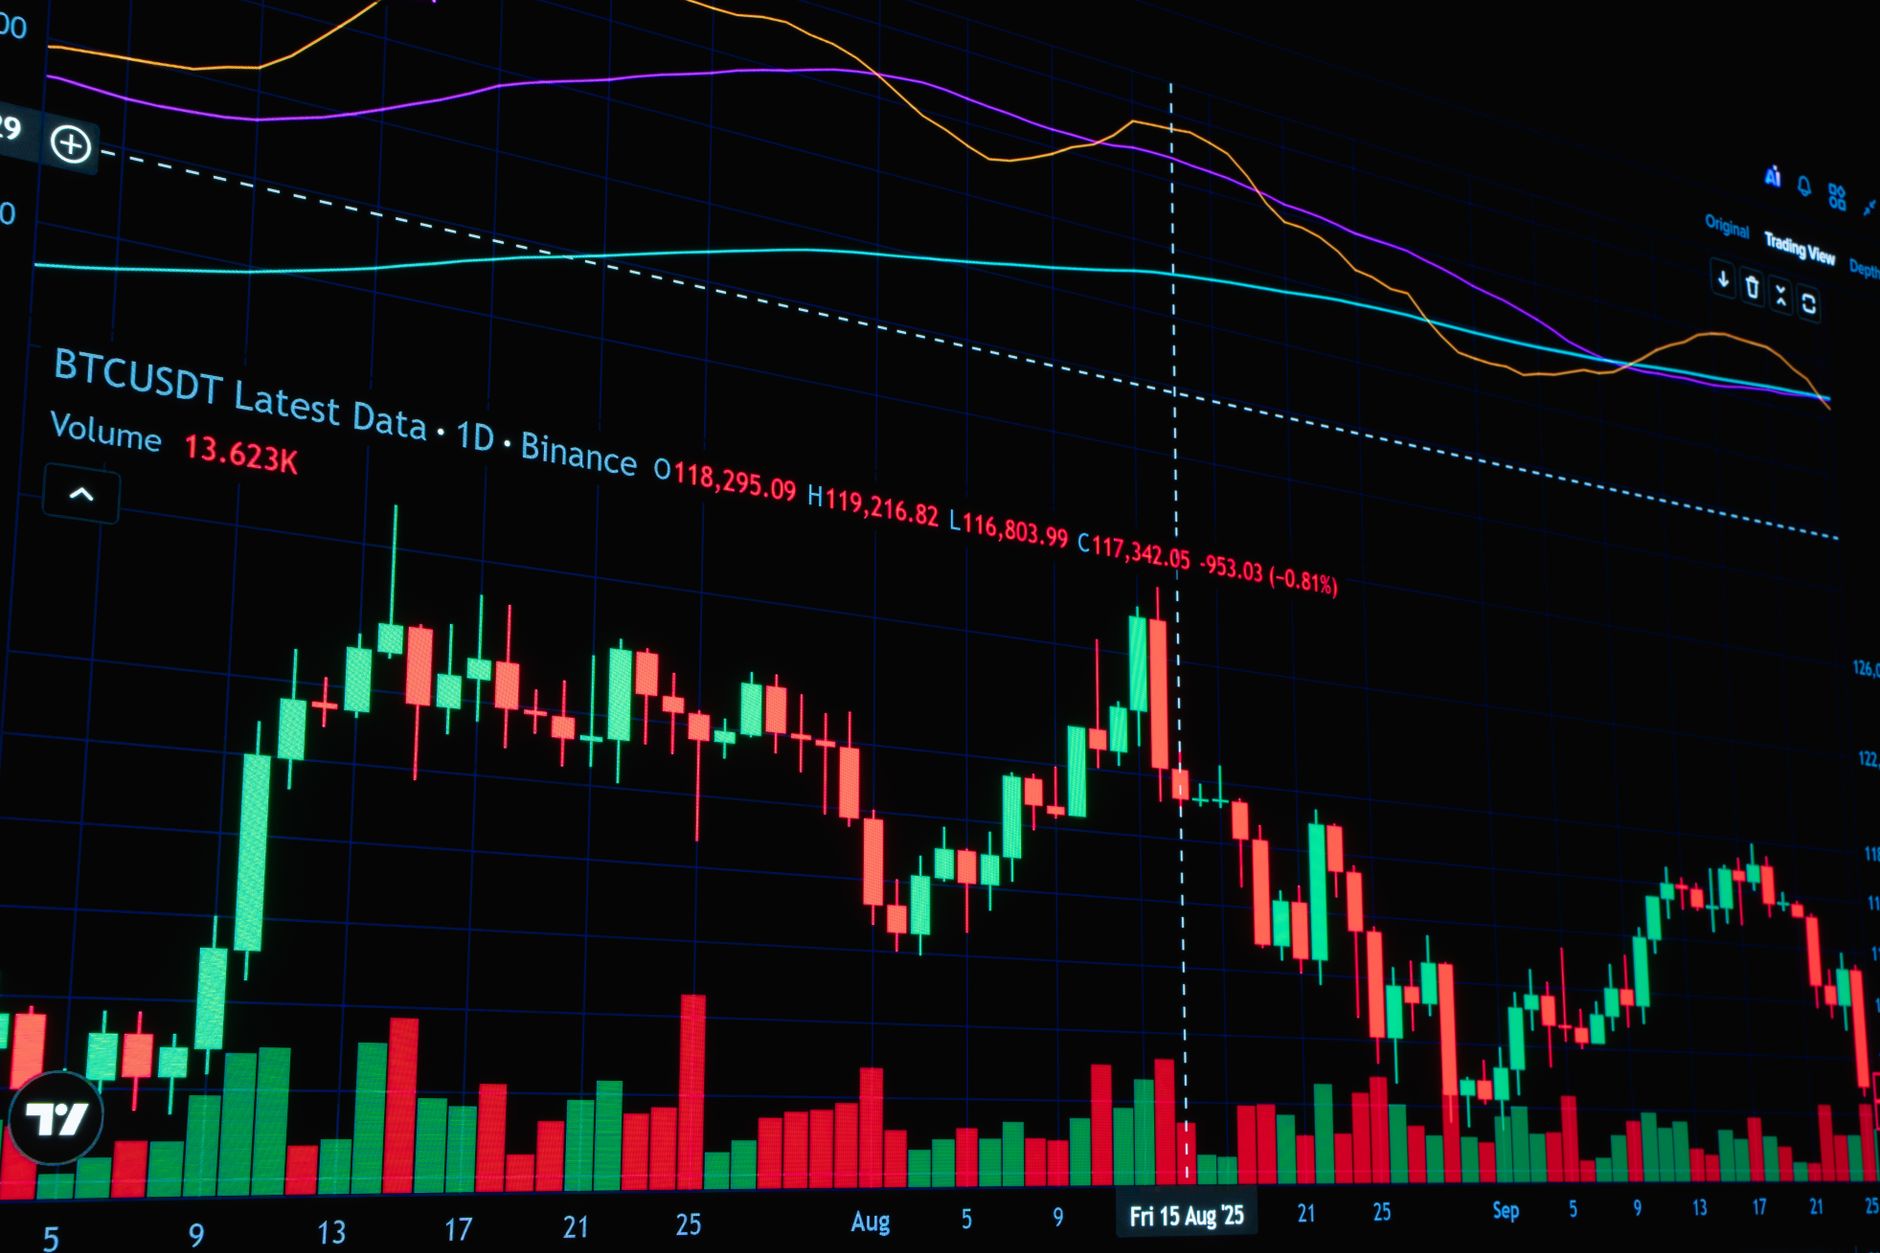
How Crypto Trading Indicators Work: Signals, Strategies & Real Examples
What Are Crypto Trading Indicators?
Trading indicators are mathematical calculations applied to historical and real-time price/volume data. They transform raw market noise into visual signals designed to help traders identify trends, momentum shifts, and potential reversal points. In cryptocurrency markets—which trade 24/7 with extreme volatility—indicators serve as a systematic framework to reduce emotional decision-making.
The core principle is simple: past price patterns often repeat. If Bitcoin (currently trading at $64,915 as of August 10, 2026) shows specific technical formations, indicators flag these patterns so traders can act before the move completes. But here's what most beginners miss: indicators are lagging tools. They reflect what already happened, not what will happen.
Think of an indicator like a car's rearview mirror—useful for context, but you need the windshield (price action, news, macro conditions) to drive forward safely.
Types of Technical Indicators Explained
Indicators fall into three main categories, each serving a different purpose:
Trend Indicators
These identify the direction of price movement. Moving Averages (MA) and Exponential Moving Averages (EMA) are the simplest examples. A 50-day EMA above a 200-day EMA signals an uptrend; the opposite signals a downtrend. For Ethereum (ETH at $1,911), a 20-day EMA acting as dynamic support is common in bull markets.
Momentum Indicators
These measure the speed and magnitude of price changes. Relative Strength Index (RSI) and Stochastic Oscillator are momentum tools. They answer: "Is the current move gaining or losing strength?" When RSI hits 70+, the asset is overbought; below 30, it's oversold. This doesn't mean reverse immediately—overbought conditions can persist for weeks.
Volume Indicators
Volume confirms the conviction behind price moves. On-Balance Volume (OBV) and Volume Weighted Average Price (VWAP) show whether professional traders are backing the move. A price spike on low volume is a red flag; the same spike on high volume carries weight.
7 Most Popular Indicators for Crypto Trading
-
Relative Strength Index (RSI)
Formula: RSI = 100 − [100 / (1 + RS)], where RS = Average Gain / Average Loss over 14 periods.
Range: 0–100. Above 70 = overbought; below 30 = oversold.
Reality check: BTC at $64,915 might show RSI = 65 (approaching overbought) but continue climbing for days. RSI overbought doesn't predict a crash—it just signals elevated momentum. Most effective on 4-hour and daily charts; useless on 1-minute charts due to noise. -
MACD (Moving Average Convergence Divergence)
Shows the relationship between two EMAs (12-day and 26-day). When the MACD line crosses above the signal line, it's a bullish signal; crossing below is bearish.
Strength: Excellent for identifying trend changes early. Weakness: Generates false signals in ranging markets. On Ethereum (ETH $1,911), a MACD bullish cross on the daily chart is worth monitoring, but confirm with price action and volume. -
Stochastic Oscillator
Formula: Stochastic = [(Close − Low14) / (High14 − Low14)] × 100
Highlights overbought (above 80) and oversold (below 20) conditions. Unlike RSI, it's faster and more responsive to recent price action. Traders often wait for the %K line to cross the %D line within overbought/oversold zones for confirmation. -
Bollinger Bands
Three lines: a 20-period SMA (middle), plus bands 2 standard deviations above and below. Price touching the upper band suggests overbought; touching the lower band suggests oversold.
Useful for: Identifying volatility spikes and support/resistance levels. Weakness: In trending markets, price can "walk the bands" for extended periods without reversing. -
Moving Averages (MA & EMA)
SMA = simple average of closing prices over N days. EMA = weighted average favoring recent prices.
EMAs react faster to price changes, making them better for short-term trading. A price above the 200-day EMA is traditionally a bullish long-term sign. Solana (SOL at $76.47) trading above its 200-day EMA supports a bias toward buying dips rather than selling them. -
Volume Weighted Average Price (VWAP)
Blends price and volume: VWAP = Σ(Price × Volume) / Σ(Volume). Traders use it as a dynamic support/resistance. When price closes above VWAP with volume, it's more convincing than a close above without volume. -
Ichimoku Cloud
A complete trading system with 5 components (Tenkan, Kijun, Senkou A, Senkou B, Chikou). Shows support/resistance, trend direction, and momentum simultaneously. Steep learning curve, but used extensively by institutional traders.
Best for: Identifying the strongest trend direction on longer timeframes (4-hour, daily).
How to Use Indicators Effectively
Step 1: Choose Your Timeframe
Indicators behave differently on 5-minute, hourly, 4-hour, and daily charts. A signal on the 15-minute chart might contradict the daily trend. Professional traders align multiple timeframes: confirm a 4-hour signal with the daily trend before entering.
Step 2: Identify Overbought/Oversold Thresholds
For RSI: Above 70 = overbought, below 30 = oversold. But these aren't reversals—they're warnings. A coin can stay overbought for 10+ candles. Use these zones as confirmation, not entry triggers.
Step 3: Wait for Signal Confirmation
Never trade a single indicator signal. Example with XRP (currently $1.0300, down 0.84% in 24h):
- Indicator signal: RSI crosses above 50 (bullish momentum building)
- Confirmation needed: Price breaks above recent resistance + Volume increases + MACD also shows bullish cross
- Entry: Only after 2–3 confirmations align
Step 4: Set Stop Losses Based on Price, Not Indicators
Place stops below recent swing lows or support levels, not "10% below" the indicator signal. Stops should reflect where your thesis breaks—if price closes below support, your analysis is wrong, and you exit.
Step 5: Track Your Win Rate
Backtest your indicator setup on at least 100 historical trades. If your win rate is below 50%, the setup is unreliable. Document exactly which indicator combination works and when it fails.
Indicator Combinations & Confirmation Strategies
Winning Combination #1: Trend + Momentum (Best for Beginners)
Setup: 50-day EMA (trend) + RSI (momentum)
Long Entry: Price above 50-day EMA AND RSI between 50–70 (rising momentum, not yet overbought)
Long Exit: Price closes below 50-day EMA OR RSI drops below 30
Real Example: Cardano (ADA $0.1952, down 1.74% 24h) trading above its 50-day EMA with RSI = 45 is a mild buy signal. If RSI hits 75, it's overbought—consider taking partial profits.
Winning Combination #2: Divergence Detection (Advanced)
Setup: Price Action + RSI or MACD
Signal: Price makes a new high, but RSI makes a lower high (bearish divergence). This often precedes reversals.
Example: BNB ($604, up 0.02%) reaches $650 (new high) but RSI only reaches 68 (lower than previous high of 74). This hidden bearish divergence suggests sellers are taking control—a short entry or profit-taking zone.
Winning Combination #3: Multi-Timeframe Confluence (Most Reliable)
Setup: Daily trend + 4-hour entry + 1-hour timing
Process: Confirm uptrend on daily (price above 200-day EMA). Find a bullish 4-hour signal (MACD cross). Enter on the 1-hour chart when RSI bounces from oversold (below 30).
Result: Three timeframes aligned = highest probability setup. False signals drop from 50% to ~30%.
Best Platforms for Technical Analysis
| Platform | Best For | Indicators Available | Free Tier | Learning Curve |
|---|---|---|---|---|
| TradingView | Charting & advanced analysis | 100+ built-in + custom scripts | Yes (limited charts) | Beginner-friendly |
| Binance | Trading + basic charting | 30+ indicators | Yes (full access) | Easy |
| Kraken | Advanced traders | 40+ indicators | Yes | Intermediate |
| Altrady | Multi-exchange trading | 50+ indicators | No (paid plans) | Intermediate |
| Coinigy | Portfolio tracking & alerts | 30+ indicators | No (14-day trial) | Intermediate |
Recommendation for beginners: Start with Binance for live trading (built-in charts) and TradingView for advanced analysis and backtesting.
The Truth About False Signals & Limitations
Why Indicators Fail
1. Lagging Nature
Indicators use past data. By the time they confirm a trend, much of the move is already priced in. A MACD crossover on the daily chart appears 2–5 days after the move begins.
2. Sideways Markets Destroy Indicators
When price ranges (not trending), every indicator generates whipsaw signals. Stochastic bounces from 20 to 80; RSI oscillates. You get stopped out repeatedly on minor moves.
3. Divergence Lies
A bearish divergence (price new high, RSI lower high) doesn't guarantee a reversal. Bitcoin has made 10+ new highs with falling RSI and continued climbing for months.
4. Volatility Spikes Invalidate Thresholds
During flash crashes or rally spikes, overbought/oversold thresholds mean nothing. BTC can spike 10% in 15 minutes; RSI hits 90 on legitimate strength, not just noise.
How to Mitigate False Signals
- Combine 2–3 indicators. Don't act on one signal. Require RSI + MACD + price action agreement.
- Use filters. Only trade when the daily trend aligns. Ignore 1-hour signals against the 4-hour trend.
- Backtest first. Test your setup on 100 historical trades. If win rate is below 50%, abandon it.
- Focus on risk. Indicators don't control profit/loss—stop losses and position sizing do. A perfect signal with poor risk management is worthless.
- Read price action. Support, resistance, and volume patterns matter more than indicator values. A break of a major support level on high volume beats any RSI reading.
"Indicators are like a compass—useful for direction, but not a substitute for a map. Price action is your map."
— Trading principle from technical analysis frameworks outlined by financial education sources
Frequently Asked Questions
What is the best indicator for crypto trading?
No single "best" indicator exists. However, the combination of EMA (trend) + RSI (momentum) is most reliable for beginners because it's simple, generates fewer false signals than standalone tools, and adapts to multiple timeframes. According to technical analysis frameworks, moving averages and momentum oscillators form the foundation of institutional trading systems.
How do I use RSI correctly?
RSI above 70 doesn't mean "sell now." It means momentum is strong, so be cautious about shorts and consider taking profits on existing longs. Below 30 doesn't mean "buy now"—confirm with volume and price bouncing from support. Use RSI as a filter, not a standalone signal.
Is MACD better than RSI?
No—they measure different things. MACD identifies trend changes; RSI identifies momentum extremes. Use both: MACD tells you if trend is reversing, RSI tells you if the current momentum is sustainable. On Dogecoin (DOGE $0.0696, down 1.16%), a MACD bearish cross confirms a downtrend; RSI below 30 suggests the downtrend may be near a short-term bounce.
Can I make money with just indicators?
Yes, but not reliably. Indicators improve your odds from 50/50 (random guessing) to perhaps 55-win rates that vary significantly with proper combinations. The real profit comes from risk management: risking 1-2% per trade, using stops, and letting winners run. A win rates that vary significantly with a 2:1 profit/loss ratio is profitable long-term.
Which timeframe is best for crypto trading?
Depends on your style: 1-5 min = scalping (requires monitoring constantly); 15-60 min = day trading (2-4 hour commitment daily); 4-hour = swing trading (30 min/day); daily = position trading (5 min/day). Start with the 4-hour timeframe—slow enough to avoid noise, fast enough to catch moves within days.
Do professional traders use indicators?
Yes, but not as the primary tool. Institutional traders use indicators to confirm price action, macro analysis, and order flow (where large orders are placed). They're not indicator-driven; they're price-driven with indicators as supporting evidence.
Final Thoughts: Building Your Indicator Edge
Indicators work best not as standalone signals but as part of a complete trading system. Here's what separates successful traders from losing ones:
Losing traders: Chase every indicator signal, overtrade, ignore risk management, blame the indicator when they lose.
Winning traders: Test their setup on 100+ trades, wait for multiple confirmations, risk only 1-2% per trade, and adjust based on backtesting results.
Start with a simple combination (EMA + RSI + Volume), backtest it on one asset (Bitcoin or Ethereum) for 100 candles, and track your results. If win rate is below 50%, you need to adjust—not the indicators, but your entry/exit rules or timeframe.
The technical indicators available today—from RSI to Ichimoku—are powerful tools. But they're tools, not trading strategies. Comprehensive guides on technical indicators emphasize that education and disciplined application matter more than the indicator itself. Trade what you understand, test before risking real money, and always protect your capital first.
Explore More Crypto GuidesRelated Resources
Strengthen your trading foundation with these related topics:
- Best Crypto Exchanges for 2026: Complete Comparison
- Risk Management in Crypto Trading: Position Sizing & Stop Losses
- Bitcoin Technical Analysis: Current Trends & Support Levels
- Cryptocurrency Basics: What Every Trader Should Know
- How to Backtest Trading Strategies: A Trader's Guide
- DeFi Trading & Yield Strategies
- Complete Trading Guides Hub