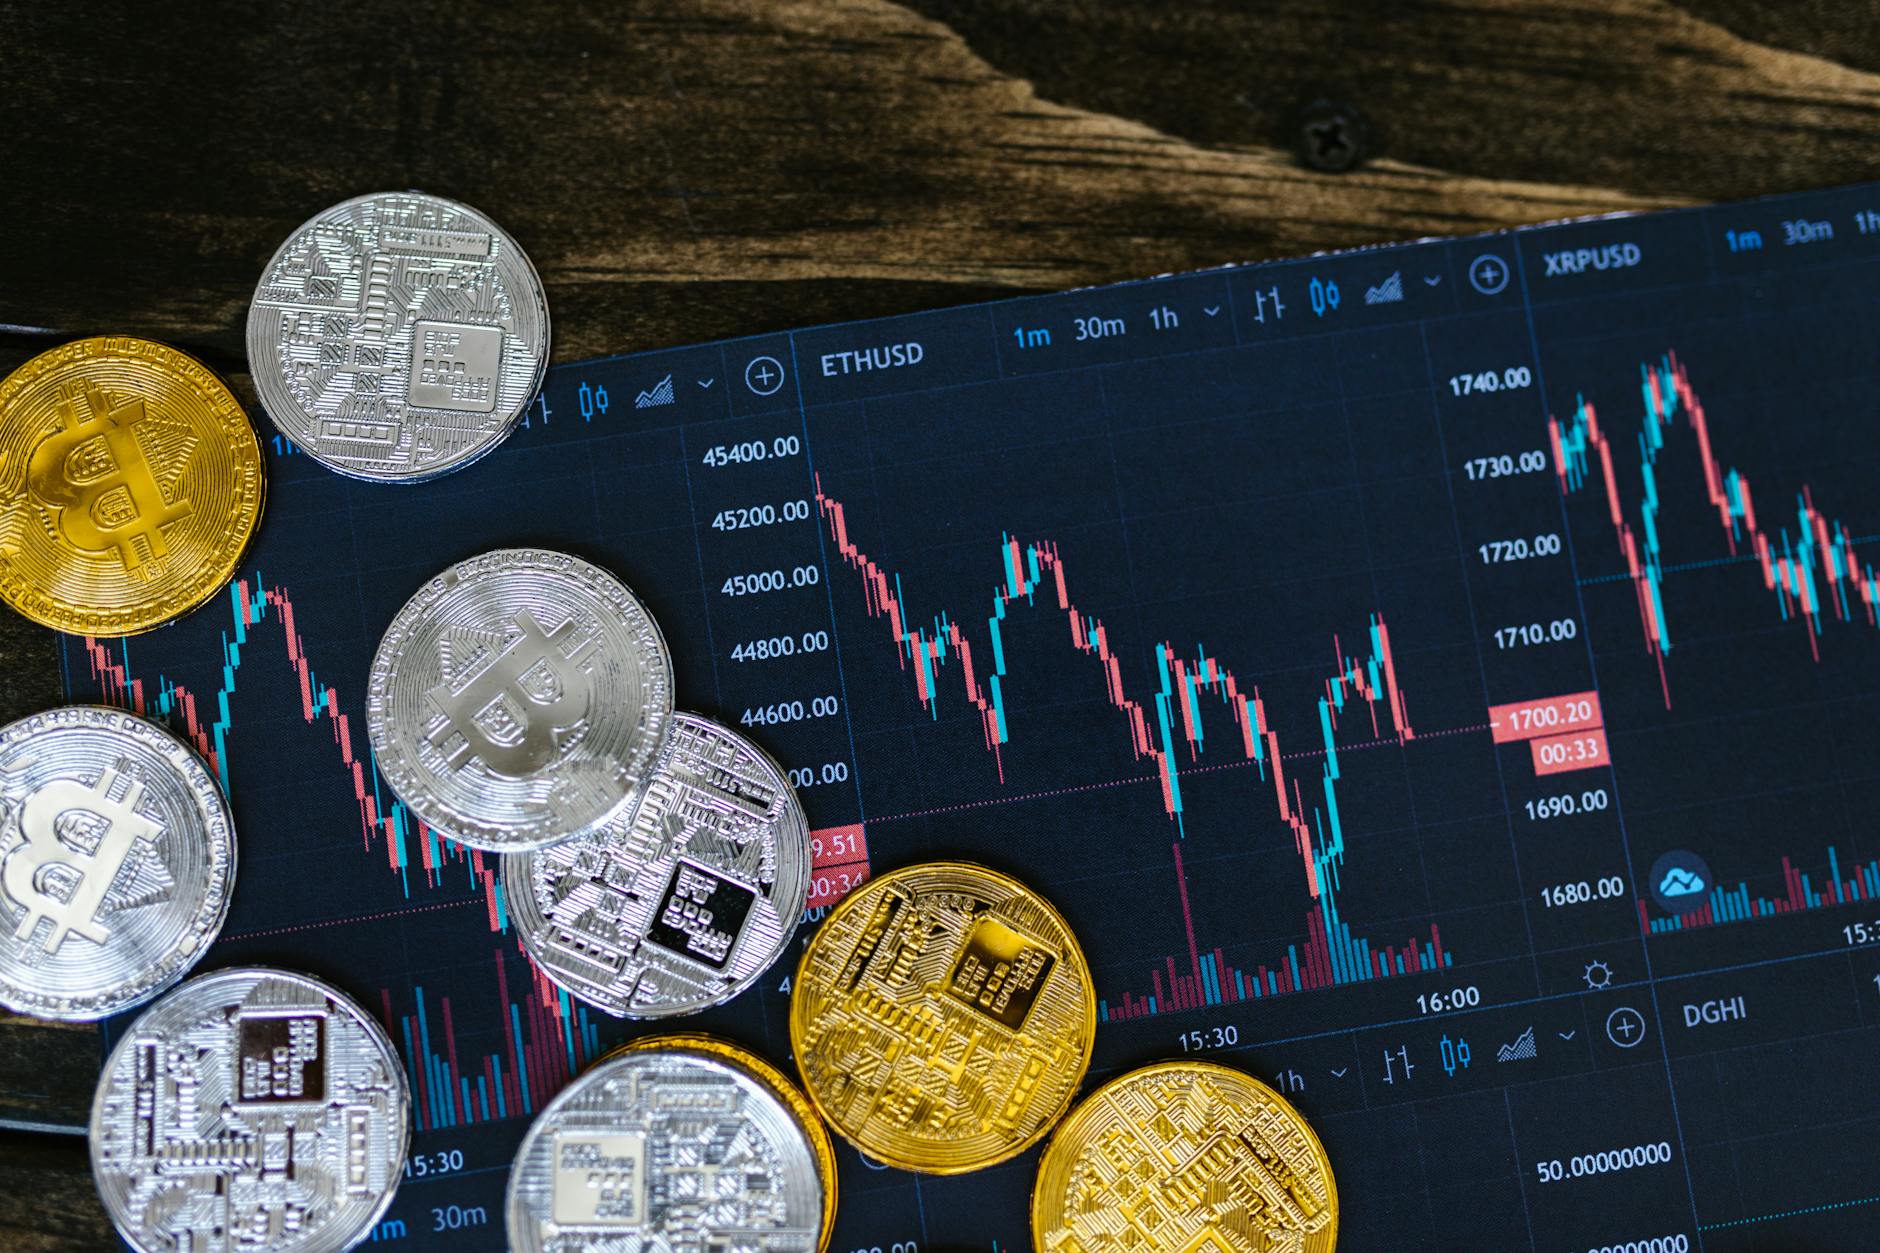
The Altcoin Season Index Playbook: How to Read Signals and Spot Real Emerging Opportunities
What Is the Altcoin Season Index?
The altcoin season index is a straightforward metric that measures Bitcoin's dominance relative to the broader cryptocurrency market. It answers one critical question: Are traders rotating money out of Bitcoin and into alternative cryptocurrencies?
When the index is high (above 70), Bitcoin dominates, and altcoins underperform. When the index is low (below 40), altcoins are winning—capital is flowing away from Bitcoin into smaller-cap projects. The index oscillates between these extremes in cyclical patterns that savvy traders have learned to exploit.
Think of it as a sentiment thermometer. Bitcoin is crypto's anchor asset, the "safe bet" in the space. Altcoins are the risk-on play. When institutional money feels confident and retail FOMO peaks, altcoins rally. When fear spikes or regulatory pressure mounts, money floods back into Bitcoin for safety.
According to CoinMarketCap, the index uses a formula tracking the percentage of top 50 cryptocurrencies (by market cap, excluding Bitcoin) that are trading above their 200-day moving averages. Simple in design, powerful in application.
Current Index Readings and Market Context (July 2026)
As of July 14, 2026, the altcoin season index stands at 58 out of 100. This is the middle ground—neither euphoric nor capitulated. Here's what's happening in the broader market:
| Asset | Price | 24h Change | Signal |
|---|---|---|---|
| Bitcoin (BTC) | $62,506 | -0.34% | Consolidating |
| Ethereum (ETH) | $1,782 | +0.25% | Slight strength |
| Solana (SOL) | $75.03 | -0.97% | Weakness |
| Cardano (ADA) | $0.1574 | -0.84% | Correction |
| Polkadot (DOT) | $0.83 | +0.74% | Emerging strength |
| Uniswap (UNI) | $3.58 | +1.67% | DeFi leading |
The index reading of 58 suggests we're in a transitional phase. Bitcoin isn't dominating, but altcoins haven't staged a full breakout either. This is where patient traders position for the next move. Historical analysis shows that index readings in the 50-65 range typically precede major altseason runs lasting 60-90 days.
How to Read Altseason Signals Like a Pro: The Three-Tier Framework
Tier 1: Index Level Interpretation
- Index above 70: Bitcoin dominance phase. Altcoins underperforming. Risk-off environment. Avoid size in alts.
- Index 50-70: Transition zone. Money rotating. Early entries forming. Strategic positioning window.
- Index 40-50: Altseason acceleration. Clear outperformance. Momentum traders entering. First major wave.
- Index below 40: Peak altseason or capitulation. Euphoria risk highest. Consider profit-taking. Historically marks local tops within weeks.
Tier 2: Rate of Change Matters More Than Absolute Level
A falling index is more bullish than the absolute number. If the index drops from 65 to 58 in two weeks, that momentum shift signals capital rotating aggressively into alts. Conversely, an index stalling at 58 after a fast drop may indicate consolidation before the next leg lower (more bullish for alts).
Tier 3: Confluence with Bitcoin Price Action
Bitcoin's technical position matters intensely. If Bitcoin breaks above $65,000 while the index stays at 58, that's a bullish divergence—Bitcoin strength that doesn't crush altcoins signals institutional confidence in the entire crypto market. That's actually optimal for altseason (rising tide lifts all boats). Conversely, if Bitcoin crashes to $55,000 and the index climbs to 75, that's a flight-to-safety move that hurts alts severely.
Bitcoin Dominance: The Core Threshold
Bitcoin dominance is the inverse of the altcoin season index. If Bitcoin dominance is 45%, the altseason index is 55% (approximately—the calculation is more nuanced, but this ratio illustrates the relationship).
Institutional traders watch these dominance thresholds religiously:
- Bitcoin dominance above 50%: BTC controls half the entire crypto market cap. Risk-off. Alts compressed.
- Bitcoin dominance 45-50%: Balanced. Early altseason signal forming.
- Bitcoin dominance 40-45%: Clear altseason. Alts allocated meaningful capital. Typical during bull runs.
- Bitcoin dominance below 40%: Peak altseason. Maximum capital flowing to alts. Risk of sudden reversals highest.
At an index of 58, Bitcoin dominance is roughly 42-44% (depending on how the index provider weights tokens). This is the sweet spot—alts are receiving meaningful capital, but we haven't hit the euphoria zone yet. Historical peaks of 64 on the index correspond to Bitcoin dominance around 36%, marking the danger zone.
Beyond the Index: On-Chain Metrics That Matter
The index is a starting point, not a complete picture. Professional traders layer on-chain data to separate real altseason from noise:
Whale Movement Tracking
Watch for large wallet accumulation (addresses holding 1,000+ ETH or equivalent alt holdings). When whales accumulate altcoins aggressively while the index is 50-60, that's institutional conviction. When whale holdings peak and start liquidating, the altseason top is near.
Exchange Inflows and Outflows
Money flowing into exchanges suggests selling pressure ahead. Money flowing to self-custody suggests accumulation. During the 58-reading phase, look for which altcoins see net outflows (hodlers locking in gains) versus which see stable or inflows (accumulation continuing).
Smart Money Tracking
Platforms like CoinGecko and specialized analytics track smart money addresses—wallets with consistent profitability. If smart money is rotating from established alts (like Ethereum at $1,782) into smaller-cap projects, that's a secondary wave signal. If smart money starts taking profits, altseason is topping.
Funding Rates in Perpetual Futures
When altcoin perpetual funding rates spike above 0.05% per 8 hours, that's leverage euphoria. A sustainable altseason has moderate funding (0.01-0.03%). Extreme funding rates are local top warnings.
Portfolio Allocation Strategies Based on Index Levels
Here's how institutional traders adjust positioning as the index moves:
Index 50-55 (Current Environment): The Accumulation Phase
- Reduce Bitcoin to 40-45% of crypto holdings (from typical 50-60%).
- Deploy 25-35% into established alts: Ethereum, Solana, Cardano, Polkadot, Uniswap.
- Reserve 15-20% for early-stage opportunities and emerging tokens with fundamental catalysts.
- Maintain 5-10% in stablecoins for opportunistic entries on dips.
- Use dollar-cost averaging: deploy capital over 3-4 weeks, not all at once.
Index 55-65 (Momentum Phase): The Risk-On Position
- Bitcoin drops to 30-40% (or lower if conviction is high).
- Established alts climb to 40-50% of allocation.
- Emerging/presale tokens can hit 10-15%, but with strict position sizing (never more than 2-3% per individual token).
- Watch for the index topping above 64—when it does, begin taking profits from highest-conviction positions.
Index 40-50 (Peak/Topping): The De-Risk Phase
- Start profit-taking from alts that have 3x'd or more.
- Rebalance Bitcoin back to 50-60% to lock in relative outperformance.
- Trim emerging token positions entirely—this is when FOMO traps retail traders.
- Consider taking off 20-30% of overall crypto exposure to cash or bonds.
Risk Management During Altseason: The Framework That Separates Winners
Position Sizing Rules
- Established alts (Ethereum, Solana, Cardano): Up to 3-5% of portfolio per token. You can concentrate here because liquidity is deep and volatility is managed.
- Mid-cap alts (Polkadot, Chainlink, Avalanche at current prices): 1-2% per token. These are riskier—lower liquidity, faster reversals.
- Emerging tokens or presales: Maximum 0.5-1% per token. Bankruptcy risk is real. Never let a single moonshot bet exceed 5% of total portfolio.
- Never invest more than 30% of liquid net worth in alts, regardless of index reading. The index can reverse from 58 to 75 in two weeks.
Stop-Loss Discipline
Altseason amplifies both gains and losses. A token up 100% can drop 60% in days. Set hard stops:
- Established alts: -20% from entry (allows for normal volatility).
- Mid-cap alts: -25% from entry.
- Emerging tokens: -40% from entry or exit if fundamentals change.
- Use limit orders, not mental stops. Emotion during 20% flash crashes destroys accounts.
Profit-Taking Triggers
- Take 25% profit at +50% gains (lock in something immediately).
- Take another 25% at +100% gains.
- Let the remaining 50% run with a trailing stop at -15% from recent highs.
- When the index hits 64 or higher, close 50% of alt positions outright—altseason historically tops within 2-8 weeks.
Tax Implications and Timing Considerations
Altseason profits trigger capital gains tax in most jurisdictions. If you're in a high-tax country, consider:
- Taking profits at year-end to defer taxes to the next year (where applicable).
- Harvesting losses from underperforming alts to offset gains from winners.
- Holding established alts (longer-term positions) for favorable long-term capital gains rates vs. trading momentum alts (short-term rates).
- Consulting a tax professional before altseason peaks—waiting until January to sort taxes after a November-December rally is common and costly.
Entry and Exit Triggers: The Institutional Playbook
Entry Triggers (Build During 50-60 Index Range)
- Index dropping from 65+ toward 55: Capital rotating into alts aggressively. Entry window opening. Established alts are rebounding.
- Bitcoin consolidating in a tight range: BTC not threatening lower, not rallying hard. Sideways Bitcoin + falling index = prime alt accumulation.
- Positive on-chain whale metrics: Smart money addresses or whale wallets buying alts. If major addresses are accumulating, follow.
- Fundamental catalysts aligned: An alt coin announcing exchange listing, developer milestone, or partnership while the index is 55-60 is an ideal entry—you get fundamental + technical tailwind.
- Presale launches during index 50-65: Early-stage token launches during early altseason tend to perform best (avoid launches during index >70 or <40, both extremes are risky).
Exit Triggers (Reduce During 60-70 Index Range)
- Index breaks above 64: Historical peak. Trim 30-50% of alt positions. This is your "sell the news" moment.
- Bitcoin surges while alts flatline: Bitcoin rallying and taking dominance back = capital rotating out of alts. Time to exit quickly.
- Funding rates on perpetual contracts spike above 0.08% per 8 hours: Retail leverage at peaks. Professional traders are liquidating. Exit before the cascade.
- Token hits 5x or higher from entry: Congratulations. Take profits on 50% of position immediately. Altseason winners are often reversals waiting to happen.
- Regulatory news hits: A major exchange delisting alts, or regulatory crackdown announced. Index reversals after positive regulatory sentiment can be vicious. Exit with small losses rather than wait for capitulation.
- Your original thesis breaks: Fundamental deterioration (developer team departures, security vulnerabilities, failed upgrades). Don't hold a bad position because "the index says altseason is coming." Quality matters.
Frequently Asked Questions
What Is the Altcoin Season Index Exactly?
The altcoin season index measures the percentage of the top 50 altcoins (cryptocurrencies excluding Bitcoin) trading above their 200-day moving averages. A reading of 58 means approximately 58% of these top alts are in uptrends on longer timeframes. It's a momentum and capital-flow indicator, not a price prediction tool.
How Often Does Altseason Occur?
Altseason occurs approximately every 18-24 months during major crypto bull cycles. During a bull market, altseason typically lasts 2-6 months (60-180 days). We don't always get clear altseason—during bear markets or sideways consolidations, the index can stall in the 40-60 range for months without developing into a major move.
Is It Safe to Trade Based on the Altseason Index Alone?
No. The index is one input among many. Never trade on index readings alone. Combine it with Bitcoin technical analysis, on-chain metrics, broader market sentiment, and fundamental catalysts for specific tokens. Traders who buy because "the index says so" are the ones who chase pumps and sell at the bottom.
Why Did Altseason Peak at 64 Historically?
The historical peak of 64 represents the point at which so much capital has rotated into alts that the market becomes exhausted. Retail FOMO peaks around 64. Institutional smart money is liquidating. The next move is typically a sharp reversal. This isn't a hard rule—some cycles have peaked at 63, others at 66—but the 60-65 zone is historically dangerous.
Can I Predict the Next Altseason Using This Index?
Partially. You can't predict the exact timing, but you can identify favorable conditions. When the index is below 50 and starts rising, and Bitcoin is consolidating (not crashing), altseason is likely forming within 3-8 weeks. Current conditions at an index of 58 with Bitcoin steady around $62,500 suggest we're in the window where altseason could accelerate or consolidate further over the next 30-45 days.
How Should I Trade Emerging Tokens During Altseason?
Presale and early-stage tokens can deliver 10-50x returns during strong altseason, but they can also go to zero. Limit positions to 0.5-1% per token. Focus on projects with real fundamentals: active developer teams, clear use cases, exchange listing plans. Avoid pure speculation ("this coin will moon because social media says so"). During the 50-60 index range, presale entry is reasonable; during >65, avoid new projects—too much bubble risk.
What's the Relationship Between Fed Policy and Altseason?
Altseason thrives on loose monetary policy and rising liquidity. When central banks are cutting rates or injecting stimulus (as happened in 2020-2021), altseason tends to extend longer and reach higher peaks. Conversely, Fed rate hikes and quantitative tightening often kill altseason prematurely. Watch for Fed policy announcements—they can reverse the index from 60 to 70 in a single day.
Should I Use Leverage During Altseason?
Avoid it. Altseason volatility kills leveraged traders. A 30% rally in an alt might seem easy to 3x with leverage, but a 35% correction happens just as fast and liquidates the position. Altseason produces the largest absolute gains from proper position sizing and asset selection, not leverage. Professionals use modest leverage (1.5-2x max) only on established alts with deep liquidity; they never leverage emerging tokens.
"The index is a map, not a destination. Knowing we're in altseason doesn't tell you when to sell—only that rotation is happening. The traders who thrive are those who layer technical analysis, on-chain data, and risk management on top of the index signal."
— Pro Trader Daily Editorial Team
Trading Altseason: The Practical Reality
An index reading of 58 feels unremarkable until you understand what it represents: the market is moving capital into risk assets at a measured pace. This is the phase where early-moving traders build positions quietly, before FOMO grabs headlines.
The most successful altseason traders don't predict the index—they respond to it systematically. They reduce Bitcoin from 50% to 40% when the index drops from 65 to 55, not when it's already at 40. They take profits at 64, not at 30. They size small on emerging tokens (0.5-1% per bet) and concentrate on established alts where they can exit quickly if conviction breaks.
What separates amateurs from pros during altseason:
- Amateurs chase after the move: They see the index at 40 in social media posts and buy alts that are already up 200%. Professionals bought at 55-60 and are selling into strength.
- Amateurs fight the reversal: They watch the index climb from 58 to 64 and double down. Professionals are taking profits and moving to stablecoins. The index going from 64 to 75 happens in 10 days and wipes out late entries.
- Amateurs use no stops: They hold Solana from $75 down to $35 "because altseason is coming back." Professionals close at -20% because capital preservation is the goal, not holding every position to zero and back.
- Amateurs ignore tax timing: They take profits in December (triggering capital gains) and wish they'd held until January. Professionals structure sales across quarters or years to minimize tax drag.
The current index of 58 with Bitcoin at $62,506 is genuinely a favorable setup. We're past the initial panic (index wasn't at 30), but well before peak euphoria (64+). This is the accumulation window. Over the next 30-60 days, either the index drops toward 50 (stronger altseason) or climbs toward 70 (rotation back to Bitcoin). Position accordingly, but don't get married to either outcome. The index moves; traders who adapt win.
Related Resources and Further Reading
Understand the broader context of cryptocurrency trading and analysis:
- More cryptocurrency trading insights
- Technical analysis and trading strategies
- DeFi opportunities and protocols
- Market analysis and research
- Investment frameworks and portfolio management
Disclaimer
This article is educational only and does not constitute investment advice. The altcoin season index is a technical indicator, not a guarantee of future performance. Cryptocurrency markets are highly volatile and speculative. Past performance is not indicative of future results. Always conduct your own research, consult a financial advisor, and never invest more than you can afford to lose. Trading and investing carry substantial risk of loss. The prices cited (Bitcoin at $62,506, Ethereum at $1,782, etc.) are current as of July 14, 2026, and fluctuate continuously.
Explore More Crypto Analysis