What Is Technical Analysis in Crypto? How It Works
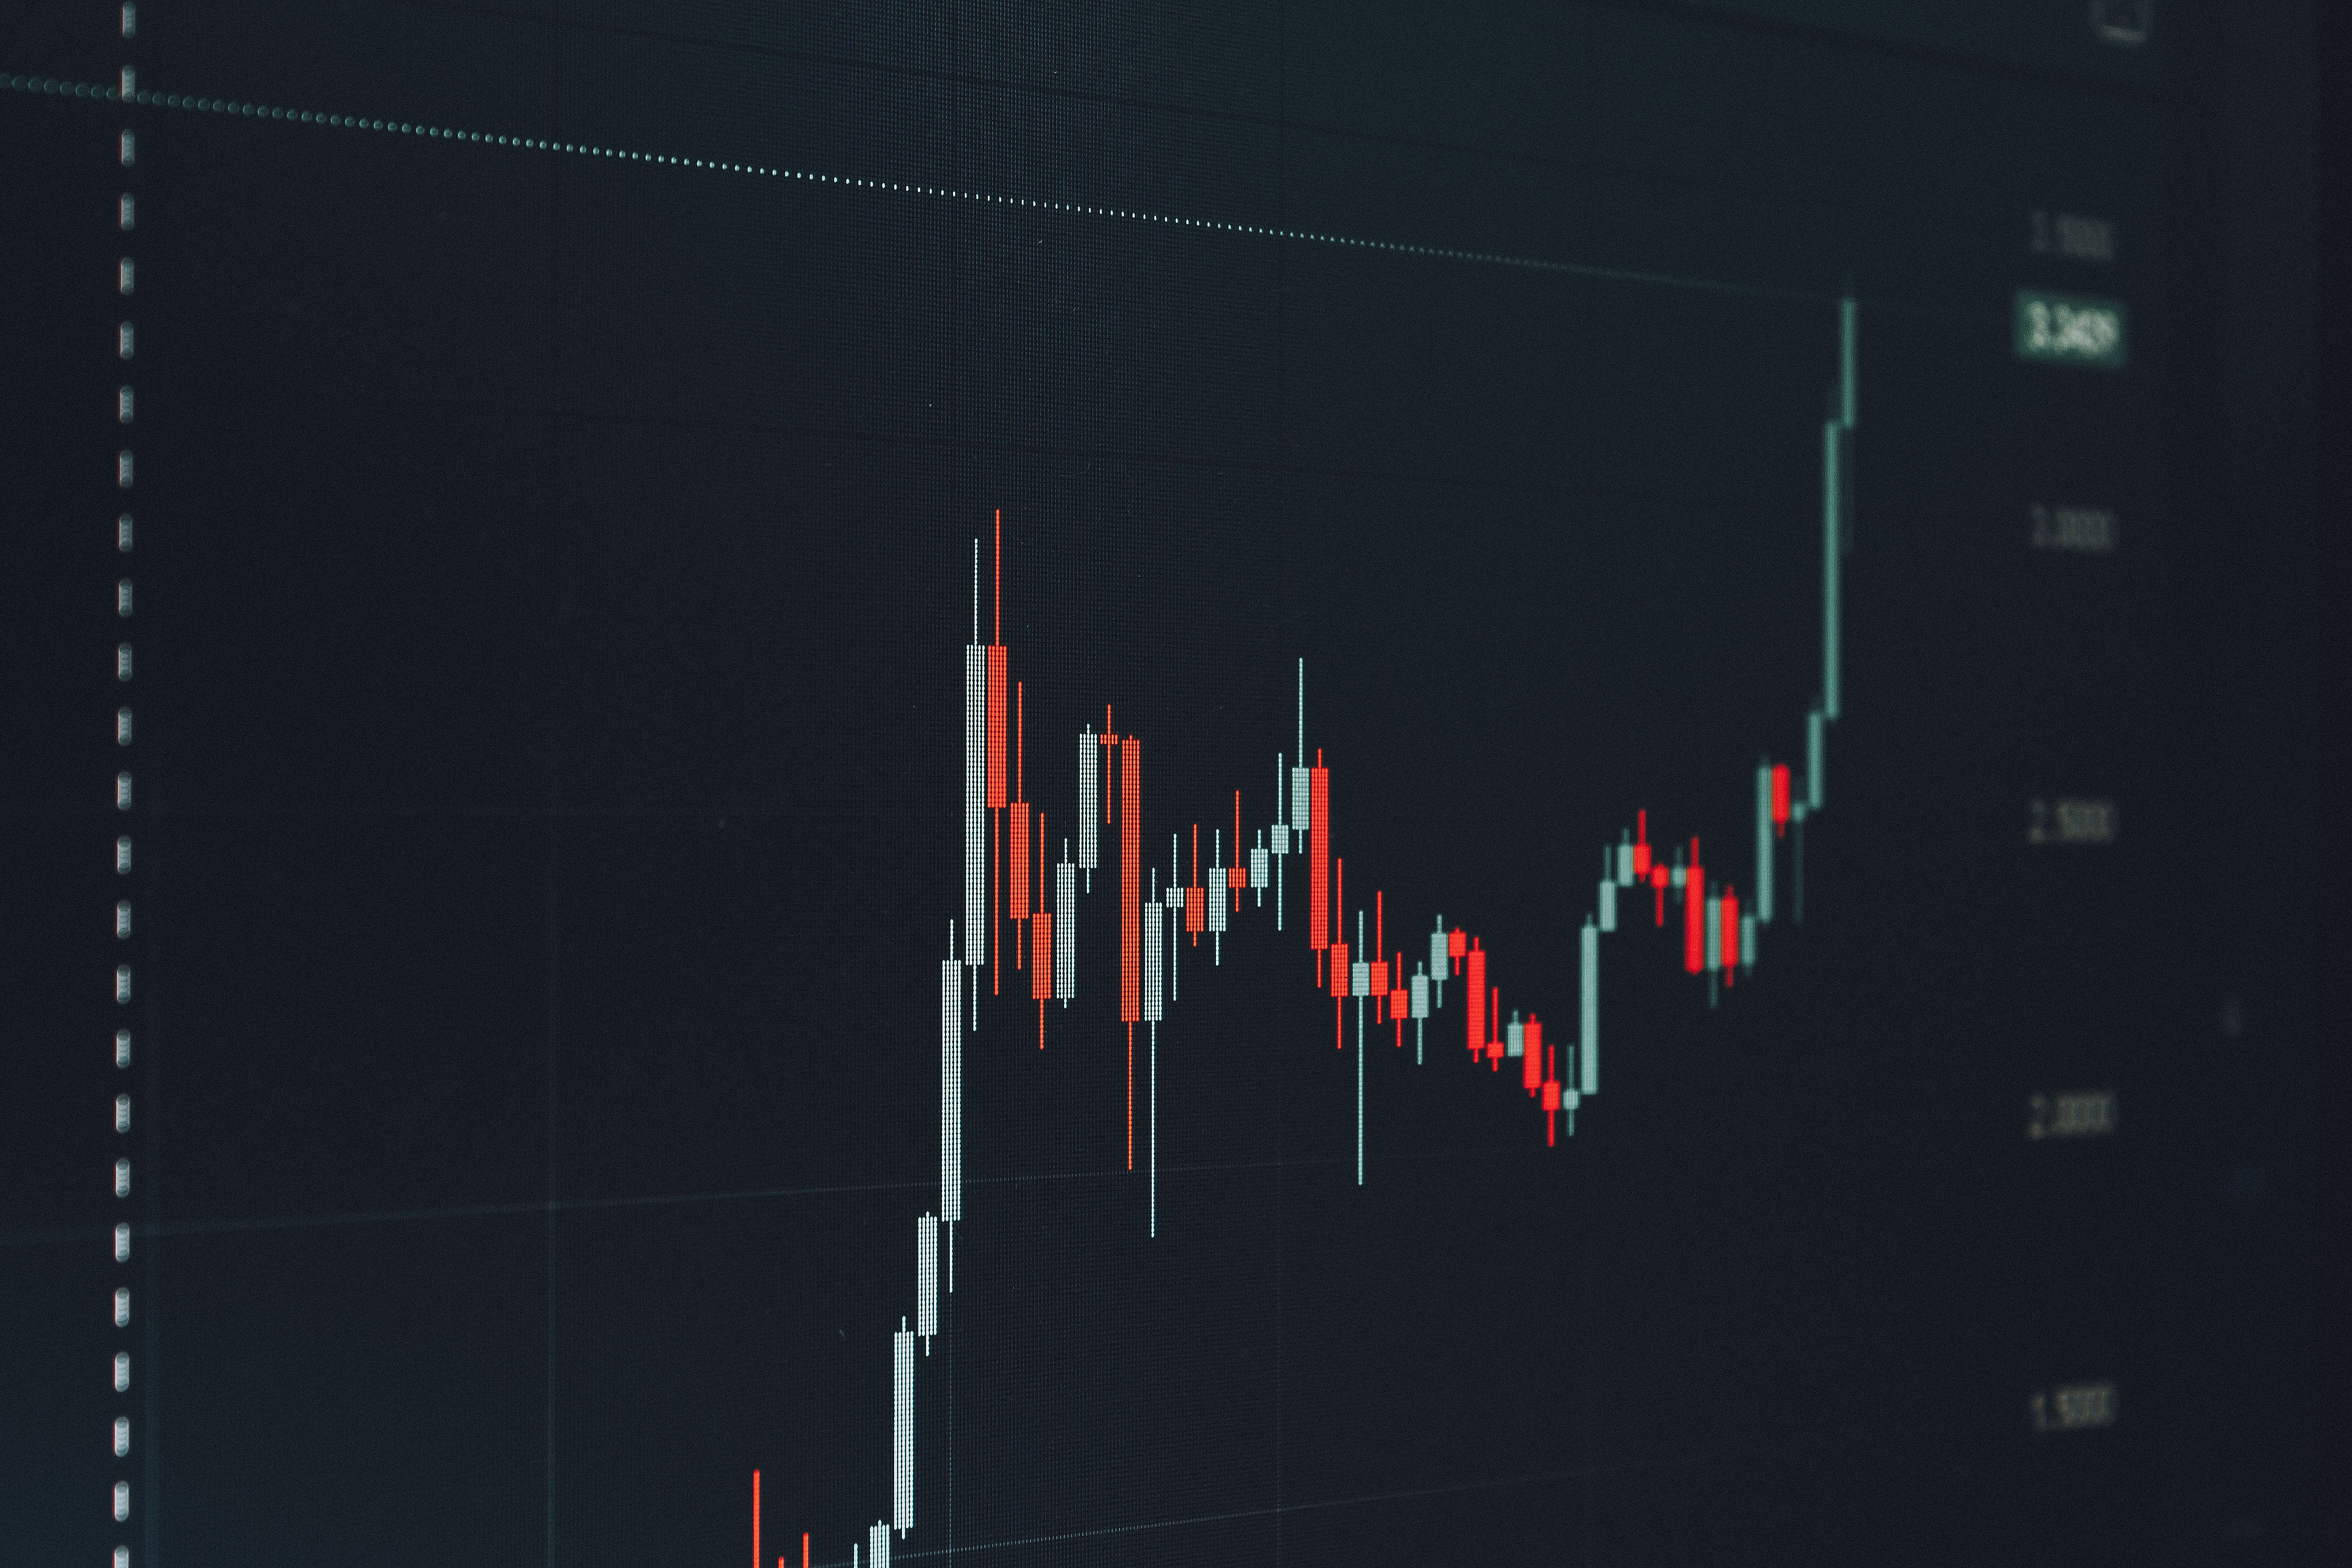
You have seen the screenshots: a candlestick chart covered in lines, arrows and a confident caption. Some of those calls look brilliant afterward. Most of them are drawn after the move happened. Technical analysis is real, and it is also easy to misuse. Understanding what it can and cannot do is worth more than memorizing any pattern.
Technical Analysis in Crypto: Overview
| Name | Technical analysis (crypto market application) |
|---|---|
| Category | Market analysis methodology based on price and volume data |
| Key features | Trend identification, support and resistance, momentum indicators, volume confirmation, chart patterns |
| Origins | Draws on long-standing chart-reading traditions and was adapted to crypto markets |
| Platforms | Exchange built-in charts and dedicated charting platforms |
| Markets | Crypto spot and derivatives, plus stocks, forex and commodities |
| Inputs | Price, volume, time |
Technical analysis is a methodology for assessing likely price behavior through the study of past market data, primarily price and volume. Coinbase's education hub draws the same line, treating it as a separate discipline from fundamental analysis, which is covered in the Coinbase explainer on technical and fundamental analysis.
Definition: What Technical Analysis Means in Crypto
Technical analysis (TA) assumes three things. Price reflects all available information. Prices move in trends. Human behavior repeats, so similar chart setups tend to produce similar reactions. You do not need to know what a blockchain does to apply it. You need a chart, a time frame and a plan.
In crypto, TA has an unusually large role. Most tokens have no earnings reports, and prices often react to sentiment, liquidity and narratives faster than to measurable fundamentals. That is why traders watch charts closely, and also why chart-based signals can fail abruptly when news hits.
How It Works on a 24/7 Market
Crypto trades around the clock, every day. There is no market close and no opening bell, so there are no traditional overnight gaps the way you see in stocks. Exchanges define their own daily candle boundaries. Check your platform's setting before you compare signals across tools.
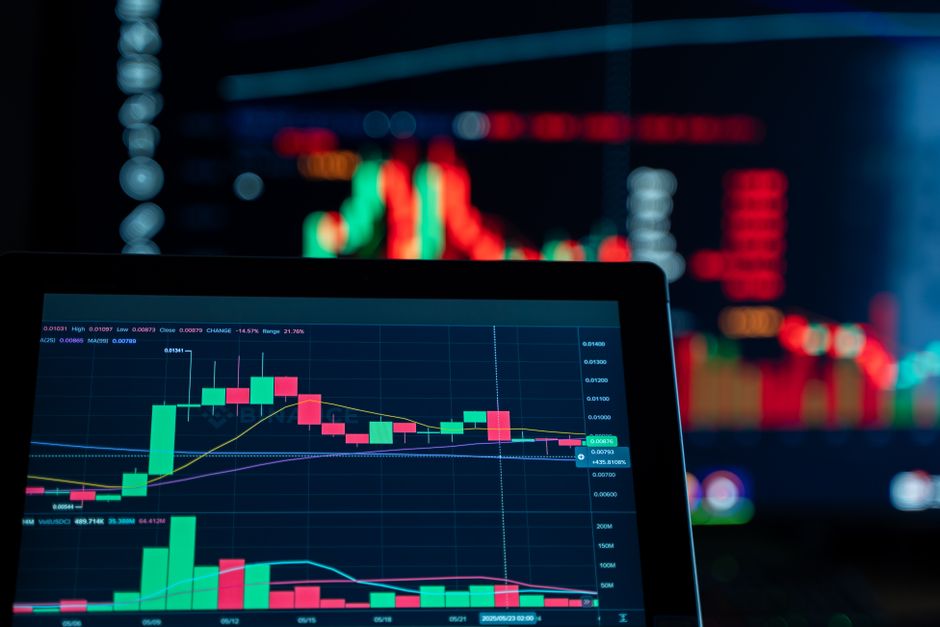
- Price action: Each candlestick shows open, high, low and close for a chosen period, from one minute to one month.
- Volume: The amount traded in that period. A move on rising volume carries more weight than one on thin volume.
- Time frames: The daily and weekly charts show the dominant trend. Lower frames like 15 minutes show more noise.
- Indicators: Mathematical transformations of price and volume. They summarize the chart; they do not add new information.
The Investopedia guide to essential crypto charts is a useful companion for the chart types themselves.
Technical vs Fundamental Analysis
The two approaches answer different questions. Fundamental analysis asks what an asset is worth. Technical analysis asks what the market is doing and where it may react.
| Factor | Technical analysis | Fundamental analysis |
|---|---|---|
| Main question | Where is price likely to react? | Is the asset undervalued or overvalued? |
| Data used | Price, volume, time | Tokenomics, network activity, team, adoption, regulation |
| Typical horizon | Minutes to months | Months to years |
| Strength | Clear entries, exits and risk levels | Context on why an asset may matter |
| Weakness | Lagging signals, false breakouts | No precise timing, subjective valuation |
| Best use | Timing and risk placement | Choosing what deserves your attention |
Many traders use fundamentals to build a shortlist and technicals to time the entry. Neither removes risk.
6 Core Tools Every Beginner Should Know
-
Support, Resistance and Trend Lines
Support is a price zone where buying has previously appeared. Resistance is a zone where selling has appeared. Draw them as zones, not exact lines. A broken resistance often becomes support, and the reverse is also common. These are among the simplest tools.
-
Moving Averages (SMA and EMA)
A moving average smooths price over a set number of periods. The 50-day and 200-day simple moving averages are commonly used. Price above the 200-day average is commonly read as a long-term uptrend. A "golden cross" is when the 50-day crosses above the 200-day; a "death cross" is the reverse. Both lag, because they confirm moves after they start.
-
Relative Strength Index (RSI)
Created by J. Welles Wilder, RSI measures momentum on a 0 to 100 scale, with 14 periods as the standard setting. Above 70 is conventionally called overbought and below 30 oversold. In strong crypto trends, RSI can stay above 70 for long stretches, so treat it as a context gauge, not a sell button.
-
MACD (Moving Average Convergence Divergence)
MACD subtracts a 26-period exponential average from a 12-period one, then plots a 9-period signal line. When the MACD line is above its signal line, momentum is conventionally read as positive. The histogram shows the gap between the two. It works best in trending markets and produces frequent false crosses in sideways ones.
-
Bollinger Bands
Developed by John Bollinger, the standard version plots a 20-period moving average with bands two standard deviations above and below. Bands widen when volatility rises and narrow when it falls. A narrow squeeze signals low volatility, not direction. Price touching a band is not a reversal signal by itself.
-
Volume
Volume tests whether a move has participation. A breakout above resistance on weak volume deserves more suspicion than one on strong volume. Volume figures vary by exchange, so compare against the same venue's history.
Worked Example: Reading Bitcoin Without Predicting It
Market data as of October 27, 2026 puts Bitcoin near $80,081. The data panel in this article shows the full indicator readings. Here is how a beginner would interpret them as a checklist, not a forecast.
- Trend: Price sits about 9.7% above the 200-day average, which is conventionally a long-term uptrend. The 50-day average moved above the 200-day on September 9, 2026, a golden cross.
- Short-term tension: Price is about 2.1% below its 50-day average, and the 30-day change is -5.1%. The longer trend and shorter move disagree.
- Momentum: RSI at 41.7 is neither overbought nor oversold. MACD is below its signal line, which is conventionally read as weaker momentum.
- Range: The 30-day high was $86,490 on October 5 and the 30-day low was $80,049 on October 26. Price is trading right at the bottom of its recent range.
- Volatility: Annualized 30-day realized volatility is 25%, which sets expectations for how far a position might swing.
Notice what this does and does not tell you. The picture is mixed: a long-term uptrend with short-term weakness. A trader could treat the recent low as a level to watch, plan what happens if it holds or breaks, and size the position accordingly. That is analysis. Declaring where price goes next is guessing.
Step-by-Step: Your First Chart Analysis
- Pick one asset and one primary time frame. Start with the daily chart of a high-liquidity coin such as Bitcoin or Ethereum.
- Identify the trend. Is price above or below the 200-day average? Are highs and lows rising or falling?
- Mark zones. As a rule of thumb, draw horizontal support and resistance where price has reversed more than once.
- As a rule of thumb, keep the number of indicators small. A moving average and RSI or MACD is plenty. More indicators usually repeat the same information.
- Check volume. Does the move have participation?
- Zoom out. Look at the weekly chart to confirm you are not trading against a larger trend.
- Write the plan before you click. Entry zone, invalidation level (where the idea is wrong), target and position size.
- Log the outcome. Save the chart and your reasoning. Reviewing results is how the skill improves.
The Psychology Behind Chart Patterns
Support and resistance are not magic. They exist because traders remember prices. People who bought at a level and then watched it drop often sell when price returns to break even, which creates resistance. Traders who missed a rally place buy orders at the prior pullback low, which creates support. Round numbers attract orders for the same reason: people think in them.
Patterns also become self-reinforcing when many participants watch the same level. That is useful, but it works against you in two ways. First, crowded levels attract stop-hunting wicks that spike through a level and reverse. Second, your own brain does the pattern-finding. Humans see shapes in random noise, and in hindsight every chart looks tidy. Confirmation bias then makes you notice the signals that agree with your position and ignore the ones that do not.
Two habits help: write your invalidation level before entering, and look for the evidence that would prove your read wrong.
Combining Technical Analysis With Risk Management
A chart setup is only half a trade. The other half is deciding how much you can lose.
| Risk control | What it does |
|---|---|
| Stop-loss at the invalidation level | Exits when the chart idea is proven wrong, not at a random percentage |
| Position sizing | Sets size so the distance to your stop equals a loss you can accept |
| Risk-to-reward check | Compares the distance to target against the distance to stop before entering |
| Limited borrowed funds | Margin and futures magnify both gains and losses and can force liquidation |
| Trade journal | Records outcomes so you can judge whether the method works for you |
Common Beginner Mistakes
- Stacking indicators. Five momentum indicators saying the same thing is one signal, not five.
- Trading tiny time frames first. One-minute charts are mostly noise and fees.
- Ignoring the larger trend. A bullish 15-minute signal inside a falling weekly trend has worse odds.
- Treating RSI 70 or 30 as automatic signals. They are conditions, not triggers.
- Moving the stop. Widening a stop because you dislike being wrong turns a plan into a hope.
- Redrawing lines to fit. If you keep adjusting a trend line after price breaks it, the line is no longer analysis.
- Applying TA to illiquid tokens. Thin order books can be moved by a single trade, which makes patterns unreliable.
Limitations and When It Fails
Technical analysis has no guaranteed edge. Anyone promising consistent accuracy should be treated with caution. Specific weaknesses matter in crypto:
- News and regulation shocks. An enforcement action, exchange failure or hack can break any chart level in minutes.
- Lag. Moving averages, RSI and MACD are calculated from past prices, so they confirm moves rather than lead them.
- Liquidity. Small-cap tokens can be pushed by a few large holders, and indicators cannot see that.
- Fragmented data. Prices and volumes differ by exchange, so identical indicators can read differently across platforms.
- Derivatives effects. Forced liquidations on futures markets can cause sharp wicks unrelated to spot demand.
Rules differ by country. Rules differ by jurisdiction, and some places may restrict certain crypto products for retail traders. Check the rules where you live before trading products beyond spot buying.
Practical Details That Trip People Up
These specifics cause more confusion than the theory does.
- Default settings: RSI uses 14 periods, MACD uses 12, 26 and 9, and Bollinger Bands use 20 periods with 2 standard deviations. Changing them without a reason makes your results incomparable with what other traders see.
- Period means candle, not day: A 14-period RSI on a 4-hour chart covers 56 hours, not 14 days.
- Candle close matters: A level broken intraday but reclaimed by the close is a weaker break than a close beyond the level.
- Log vs linear scale: On multi-year Bitcoin charts, log scale shows percentage moves more fairly. Linear scale exaggerates the recent past.
- Different tools, different numbers: Exchange and charting platforms may calculate volume or moving averages from different data feeds, so small differences are normal.
- Trade-off: Longer time frames give cleaner signals but wider stops. Shorter ones give tighter stops but more false signals and more fees.
FAQ

What is technical analysis in crypto?
It is the practice of studying crypto price charts, volume and indicators to assess trend, momentum and likely reaction zones. It uses past market data and does not require knowledge of a project's technology or team.
How do I start using technical analysis as a beginner?
Pick one liquid coin, open the daily chart, identify the trend with the 200-day moving average, mark support and resistance, then add RSI or MACD. Write your entry, stop and target before trading, and keep a journal.
Is technical analysis safe to rely on?
No method is safe on its own. Technical analysis improves structure and risk control but cannot remove losses. Crypto prices can jump on news that no chart anticipates, so use stops and risk only money you can afford to lose.
Why do technical indicators sometimes fail in crypto?
Indicators are built from past prices, so they lag. Sudden news, thin liquidity, exchange-specific data differences and liquidation cascades can all break signals that looked clean a moment earlier.
Which is better for crypto, technical or fundamental analysis?
Neither is universally better. Fundamental analysis helps decide what to follow; technical analysis helps decide when and where to act. Many traders combine both.
Disclaimer: This article is educational and is not financial advice. Trading crypto carries a high risk of loss. Past chart behavior does not guarantee future results.
Keep Learning
- Pillar: Complete crypto and market analysis guides
- Hub: Crypto news and education hub
- Related: RSI indicator explained for crypto traders
- Related: MACD indicator guide for crypto charts
- Related: how to read crypto candlestick charts
- Adjacent: how to buy Bitcoin safely
Disclosure: Pro Trader Daily and xpertrax.com are operated by the same owner. Links and pop-ups pointing to xpertrax.com promote our own products. This article is for information only and is not financial advice.